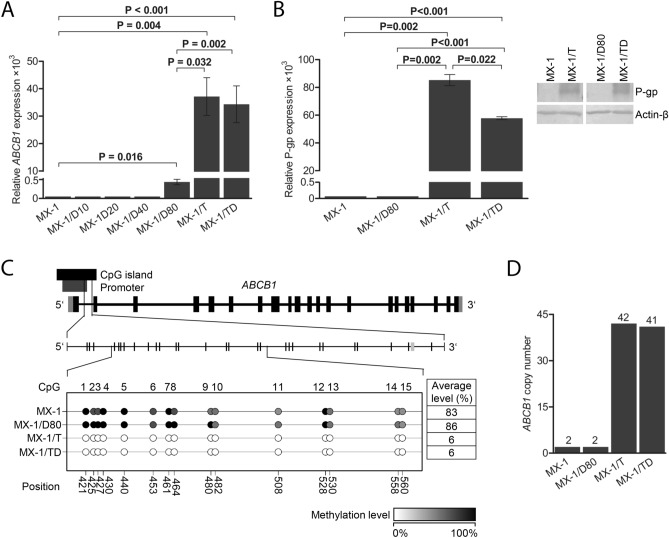
Figure 4.
Upregulation of ABCB1 transporter in chemoresistant MX-1 cells. (A) mRNA levels of ABCB1 in the MX-1 and chemoresistant cells, cultured with increasing concentrations (10 nM, 20 nM, 40 nM and 80 nM) of doxorubicin (MX-1/D10-80), ABCB1 transporter activator TPP+ (MX-1/T) or both (MX-1/TD) obtained by qPCR. The graph shows the mean (± SEM) ratio of the ABCB1 expression compared to endogenous control HPRT1 expression. (B) P-glycoprotein expression level in the parental MX-1 and chemoresistant MX-1/D80, MX-1/T and MX-1/TD cells obtained by Western blot analysis and the representative images of the experiment. The graphs show the mean (± SEM) ratio of the protein expression compared to actin β expression. P values were calculated based on paired t-tests. (C) Schematic figure detailing the CpG dinucleotides analysed by pyrosequencing in the downstream promoter of ABCB1 gene and the methylation level of the selected CpGs in MX-1 and chemoresistant MX-1/D80, MX-1/T and MX-1/TD cells, depicted in the colours and expressed by percentage. (D) The copy number of ABCB1 in non-treated MX-1 and chemoresistant MX-1/D80, MX-1/T and MX-1/TD cells evaluated by qPCR. The number of copies was calculated with Copy Caller Software v2.0 using RNaseP as an internal control.

