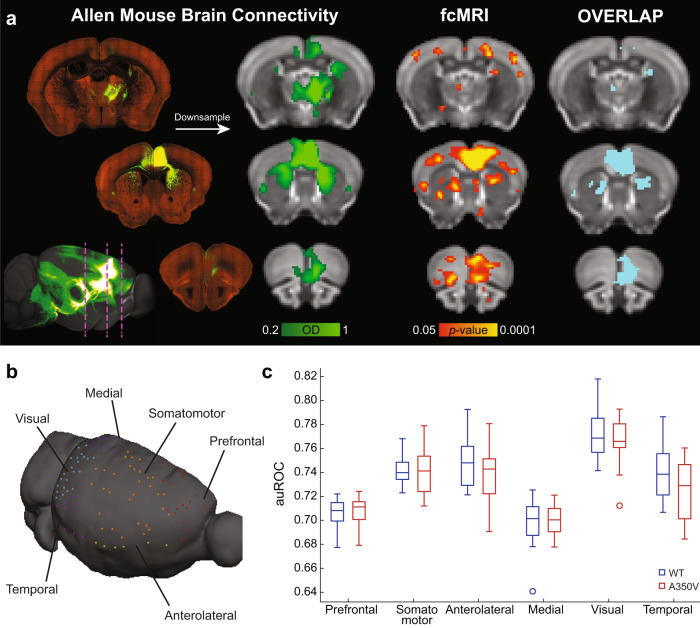
Fig. 3. Structure–function relations of the six cortical modules.
a Analysis scheme for comparing structure–function relations using MRI shown for Allen mouse brain connectivity (AMBC) atlas experiment #112514202, ACAv injection. Three representative coronal slices showing multiple anatomical connections (top, left) in AMBC space and a maximum intensity projection sagittal view of signal density (bottom, left). Approximate locations of the presented coronal sections are indicated by magenta dashed lines. The arrow indicates the corresponding downsampled coronal slices (optical density, [OD] in green-light green, normalized OD > 0.2). An fcMRI statistical parametric map (in red-yellow) of positive correlations of ACAv on a downsampled version of the AMBC Atlas that matches the original fMRI resolution; p < 0.05, corrected for multiple comparisons using family-wise error rate correction for the whole mouse brain. Overlap of functional and anatomical connectivity (pale blue) demonstrates a close agreement across the two modalities. b The seeds corresponding to AMBC tracer injections are illustrated on a mouse cortical surface. Seeds are color coded for the six cortical modules. c The six cortical modules auROC values demonstrate equivalent structure–function relations between the two groups for all modules. n = 13 per group; Boxplots represent the median (center line), interquartile range (box limits), extreme data points (whiskers), and outlier (circles).

