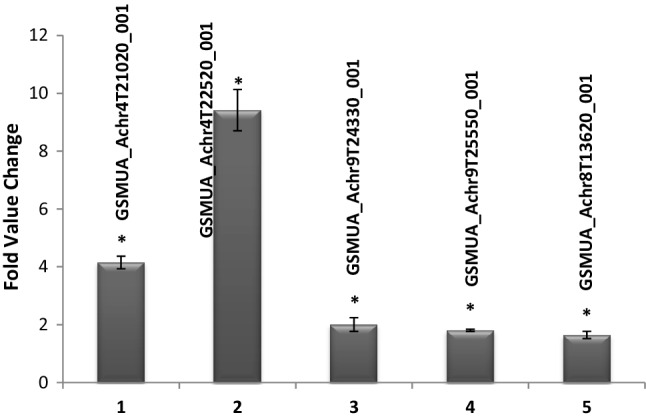
Fig. 3.

Expression analysis of Aux/IAA (indole acetic acid induced) and ARFs (auxin response factors) type auxin-responsive genes. The transcript abundance of different genes was estimated after quantitative RT-PCR in transgenic banana plants with overexpression of MusaSNAC1. The data values obtained after normalization with the expression of EF1α gene of banana spp. were represented as fold change over control values. Identity of different genes is represented as banana genome locus identifier on the top of each bar. Each data point represented mean ± SD of at least three independent replications. Statistically significant difference for at least 5% (P ≤ 0.05) is denoted with an asterisk (*)
