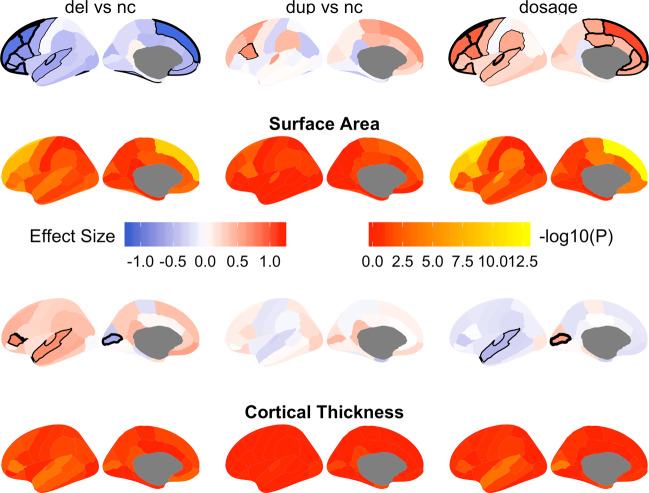
Fig. 2. Results from the t tests and linear regression of 1q21.1 copy number variation on regional cortical surface area and cortical thickness.
First and third rows: Effect sizes (Cohen’s d for the t tests, beta coefficient for the dosage/linear regression). Second and fourth rows: Statistical significance in –log 10 of the P value. Significant areas in rows 1 and 3 are marked with black lines with increasing thickness for increasing significance (P < 0.0014). The column names indicate the comparisons with del = deletion carriers, nc = non-carriers, dup = duplication carriers. All measures were corrected for age, age2, sex, scanner site and ICV.

