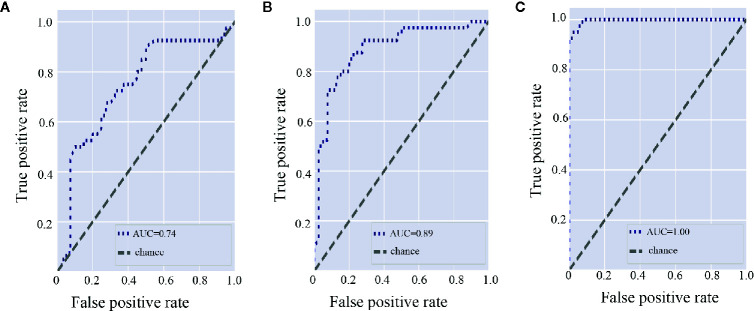
Figure 5.
Gut and oral microbiota differentiate rheumatic heart disease patients from control subjects. (A) Receiver operating characteristic (ROC) curve according to random forest model for fecal microbiota. A greater area under the ROC curve (AUC) indicates better performance. (B) ROC curve according to random forest model for subgingival plaque microbiota. (C) ROC curve according to random forest model for salivary microbiota.

