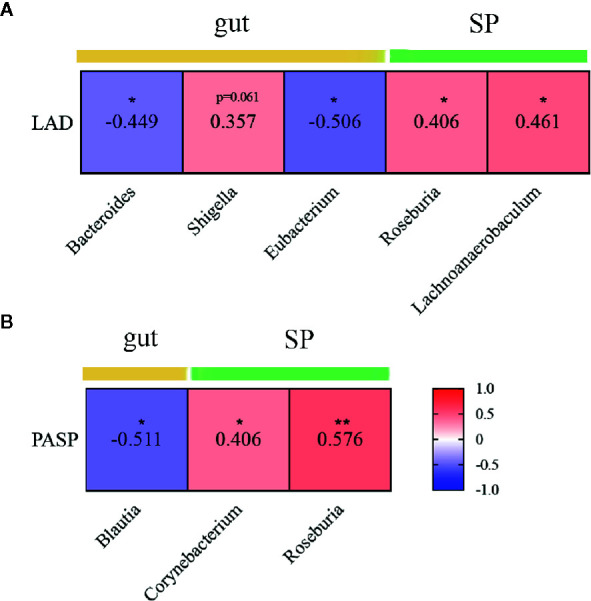
Figure 6.

Correlations between microbial genera and clinical indices in patients with rheumatic heart disease. (A) Heatmap showing correlations between different genera and LAD. (B) Heatmap showing correlations between different genera and PASP. LAD indicates left atrial diameter; and PASP, pulmonary artery systolic pressure. SP indicates subgingival plaque. Spearman’s rank correlation coefficients are illustrated in squares. *P < 0.05; **P < 0.01.
