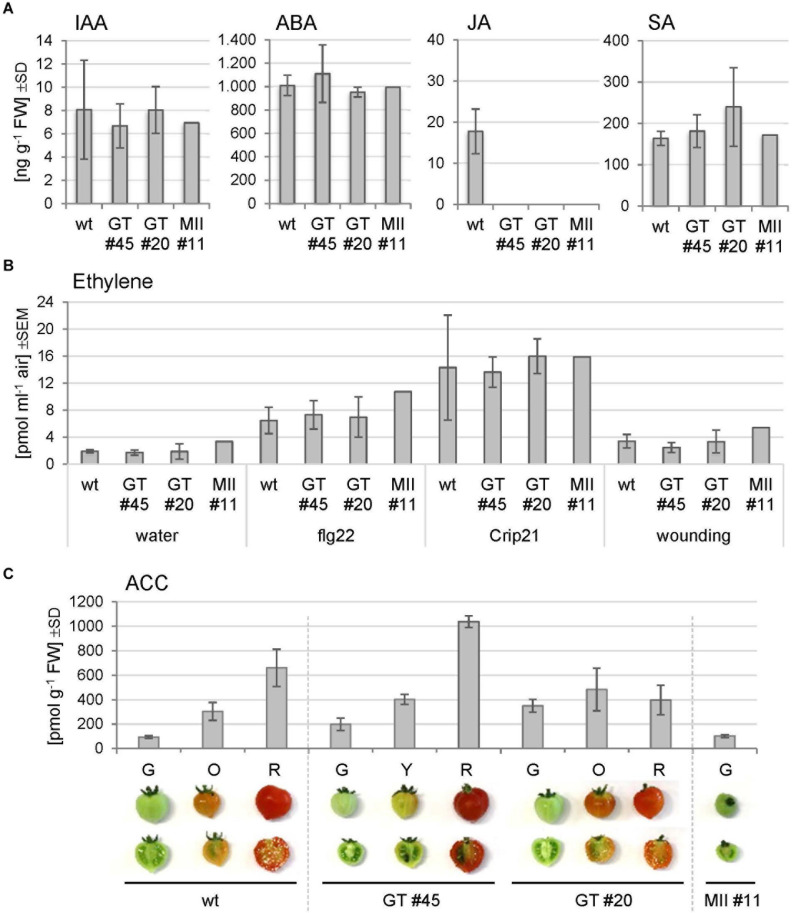
FIGURE 7.
Hormone measurements of Micro-Tom leaf and fruit extracts. (A) Phytohormone levels were determined in leaf extracts of the wild-type (wt) and indicated RNAi lines (GT, GNTI-RNAi; MII, MANII-RNAi). IAA, indole acetic acid; ABA, abscisic acid; JA, jasmonic acid; SA, salicylic acid. Bars represent the mean of three biological replicates for three plants of wt, four of each GNTI-RNAi line, and two of MANII-RNAi line #11. SD, standard deviation. (B) Ethylene emission from leaf pieces after the indicated treatments: water (mock), a bacterial elicitor (1 μM flg22), a parasitic plant elicitor from Cuscuta (1 μM Crip21), or repeated squeezing with a forceps (wounding). Bars represent the mean of three measurements with three plants per genotype, i.e., Micro-Tom wild-type (wt), GNTI-RNAi lines (GT #20, #45), and one MANII-RNAi line (MII #11). SEM, standard error of the mean. (C) Ethylene was chemically released from 1-aminocyclopropane-1-carboxylic acid (ACC) of frozen fruit halves. Micro-Tom wild-type (wt), GNTI-RNAi lines (GT #20, #45), and MANII-RNAi line (MII #11) at the ripening stages shown (G, green; O, orange; Y, yellow; R, red). Bars represent the mean of three replicates. SD, standard deviation of the mean.

