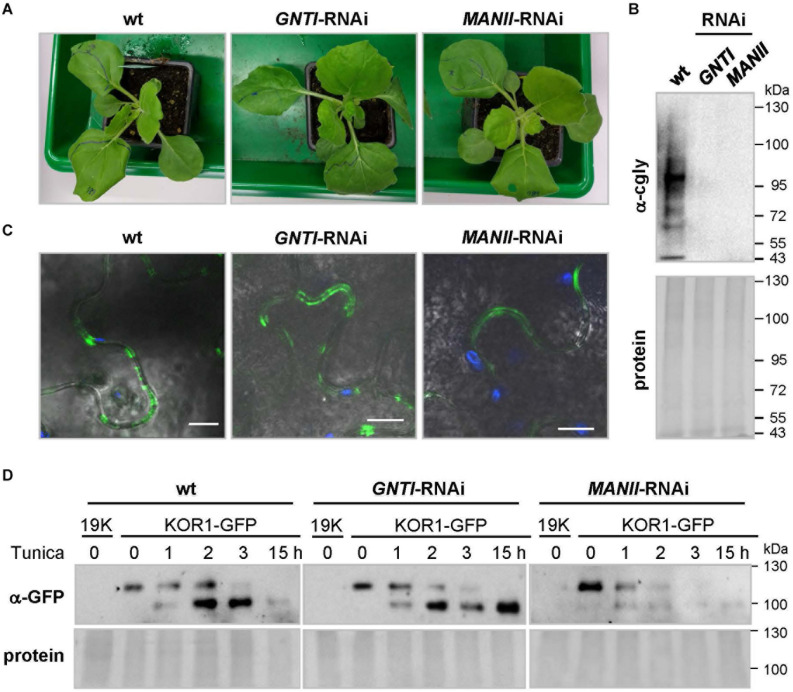
FIGURE 9.
Analysis of glycoprotein stability in N. benthamiana GNTI- and MANII-RNAi plants. (A) N. benthamiana wild-type (wt), GNTI-RNAi (#10), and MANII-RNAi (#4) T3 plants prior to agroinfiltration. (B) Immunoblot analysis of indicated leaf extracts (membrane fractions) developed with anti-complex glycan antiserum (α-cgly = α-PHA-L). The Ponceau S-stained blot (protein) is shown as the loading reference. Apparent molecular masses are indicated in kDa (PageRuler Prestained Protein Ladder, Fermentas). (C) Confocal laser scanning microscopy (CLSM) images of KOR1-GFP expression in N. benthamiana wild-type and the indicated RNAi lines. Merging of GFP (green) and chlorophyll autofluorescence (blue) with bright field. Bars = 10 μM. (D) Immunoblot analysis of leaf extracts (membrane fractions) upon agroinfiltration and development with anti-GFP antiserum (α-GFP). Tunicamycin (Tunica, 10 μM) treatment results in the accumulation of non-glycosylated KOR1-GFP (band shift). The fading top bands indicate decay due to protein turnover. 19K, co-expressed Agrobacterium silencing suppressor strain (negative control). The Ponceau S-stained blots are shown as the protein loading reference. Molecular masses are indicated in kDa (PageRuler Prestained Protein Ladder, Fermentas).

