Figure 1.
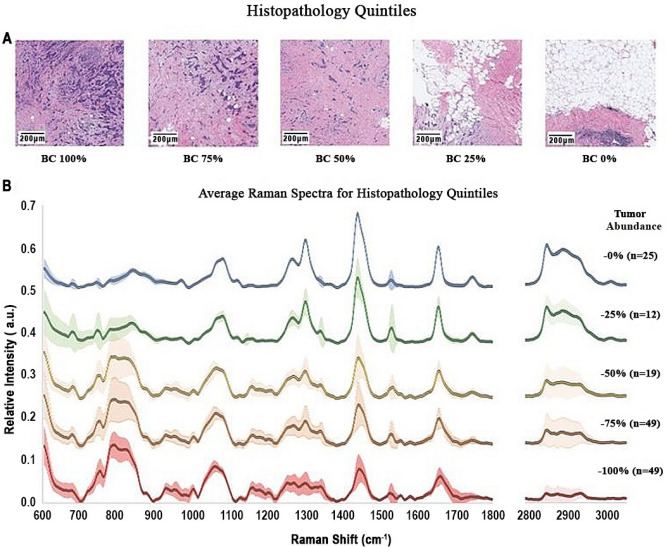
Breast cancer histopathology and corresponding laser Raman spectra (n = 154, 5 patients). Quintile estimate were made by the clinical pathologist (DS) for 1 mm2 areas surrounding the projected location of the Raman laser probe. (A) Shows the H&E stains for examples of the five tissue categories. Mean LRS spectrum for each of the five categories (n0 = 25; n25 = 12; n50 = 19; n75 = 49; n100 = 49) appear in (B). If a region is assigned to the 100% quintile it means that tumor cells are apparent in all portions of the image. If a region is assigned to the 0% quintile it means that there were no clusters of tumor cells apparent throughout the image. Quintile assignment was accomplished for 154 images and spectra acquired from five (5) patients. Average spectra are displayed along with 1-sigma error bars. Scale bars are 200 µm.

