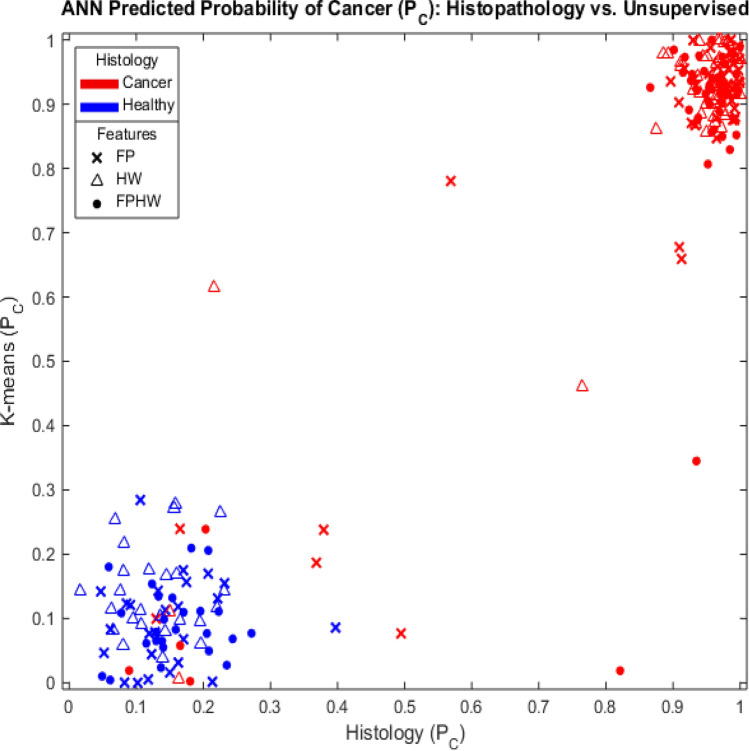
Figure 3.
Bayesian probabilistic classification for 74 spectra from 5 patients using either H&E staining (x-axis) or k-means unsupervised spectral clustering (y-axis) as training gold standard. Spectra were from regions classified by histopathology as likely to be composed of either 100% or 0% tumor. Networks were trained using as inputs (x) 6 bands from the FP region (FP); (△) 3 bands from the HW region (HW); or (●) the full set of 9 bands (FPHW). Targets obtained from tissue in tumor-rich regions according to H&E stain are denoted by red markers, while data obtained from areas apparently devoid of tumor are denoted by blue markers.

