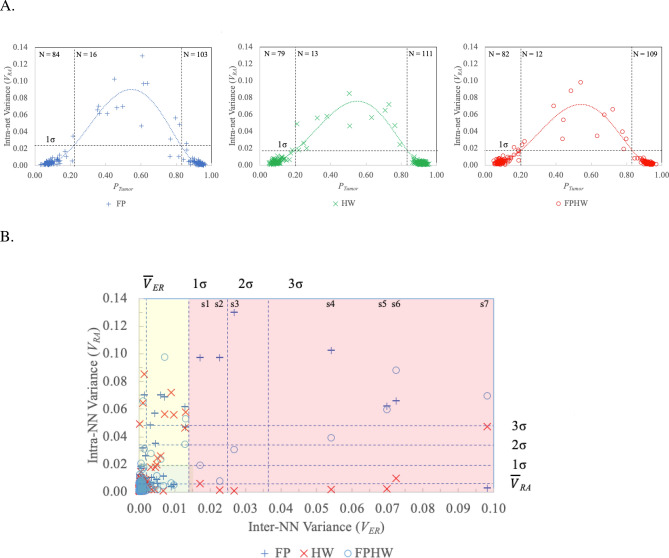
Figure 5.
Characterizing the variation in the output of each stochastic NN (intra-NN variance or VRA) and the differences in predicted tumor likelihood amongst the NN configurations (inter-NN variance, VER). The use of 3 configurations of stochastic NNs provides two useful variance estimates for assessing NN reliability and enhancing tumor detection likelihood estimates. The output variance of each stochastic NN when run through 10 complete train-test cycles with random weight resets for each cycle provides an intra-NN output variance estimate (VRA) for each of the three NN configurations. The lower the VRA, the more certain the NN is of its prediction. The inter-NN variance (VER) is then calculated as the variance in the average output probabilities (PTumor, N = 10) generated by the 3 NN configurations while determining the VRA variance for each. VER provides an immediate detection of disagreements in diagnostic predictions for the three NN configurations. (A) Depicts VRA for each of the three NN configurations as a function of PTumor between the NN training boundaries (PTumor ~ 0 = > healthy, PTumor ~ 1 = > tumor). PTumor estimates are divided into those with VRA < 1σ and VRA > 1σ. Vertical dotted lines indicate the point where a 5th order polynomial fit to the data intersects at the 1σ level. Significant increases in VRA (VRA > 1 σ) appear as expected in the boundary zone between the two classes (i.e., ~ 0.2 < PTumor < ~ 0.8). (B) Depicts VRA as a function of VER. Significant inter-NN variance (VER > 1σ) occurred in 7 targets (shaded red), all from tumor or boundary regions. In six of the seven high VER samples, the HW NN exhibits the least variance in its predictions (VRA between 0.001 and 0.10). For the other target (s7) FP exhibits the minimal variance across ten trials (VRA ~ 0.003). Spectra corresponding to these 7 targets appear in Fig. 6. See Table 6 for a comparison of the cancer probability predictions and the NN variances. Another 17 targets (yellow shading) exhibit high VRA (> 1σ), but low VER (< 1σ). See Table S2 in Supplementary Material.

