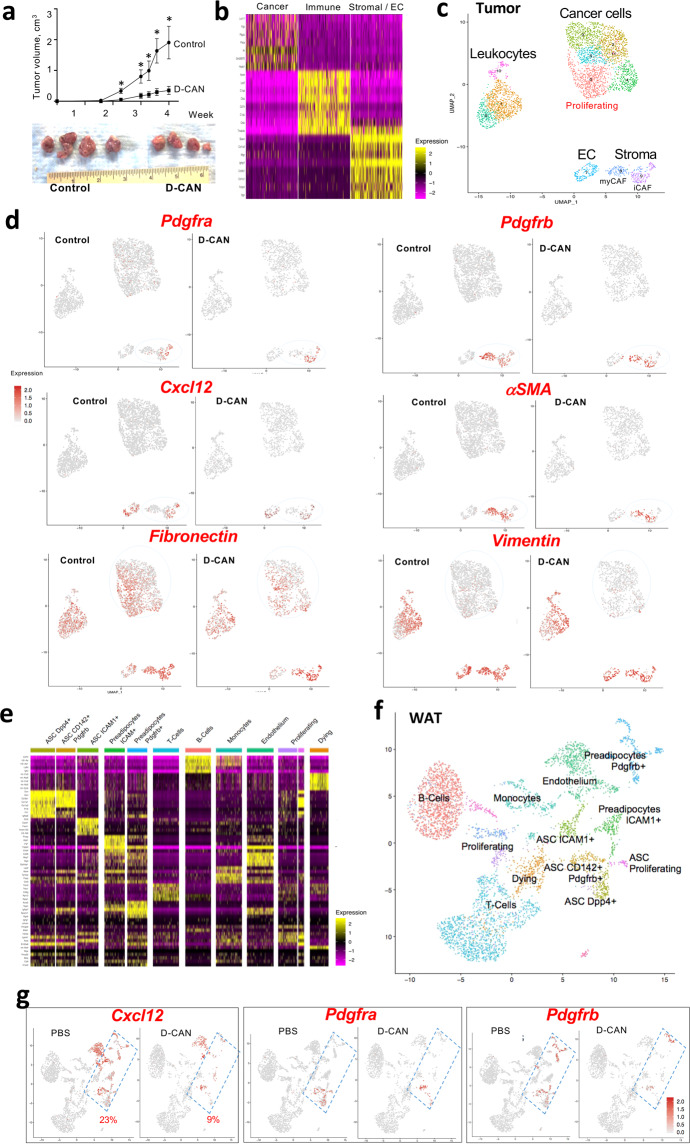
Fig. 2. Changes in tumors and microenvironment resulting from D-CAN treatment.
a Growth of Myc-Cap tumor grafts suppressed by D-CAN treatment in FVB mice fed chow. Graphed is mean tumor volume ± SEM; N = 4; *P < 0.05 compared to control (Student’s t test). b Integrated heatmap of combined tumor scRNAseq data from control and D-CAN-treated mice identifying cell populations expressing genes listed vertically. c UMAP clusters of cells identified by scRNAseq in tumors. d Co-expression (red) of Cxcl12, Pdgfra, Pdgfrb, and αSMA, in stromal cells and depletion of the co-expressing sub-population (iCAF) by D-CAN treatment. Note the reduction of Fibronectin and Vimentin expression in cancer cells. e Integrated heatmap of combined SAT scRNAseq data from PBS-injected (control) and D-CAN-treated mice. Selectively expressed genes (left) identify cell clusters designated on top. f UMAP clusters of cells identified in SAT cells by combining SAT scRNAseq data from control and D-CAN-treated mice. Proliferating cells are identified based on Ki67 expression, dying cells are identified based on mitochondrial gene expression. Subpopulations of ASC expressing Dpp4, CD142, and Icam1 are indicated. g Gene expression in UMAP clusters. Note that D-CAN depletes ASC and preadipocytes (combined with the defined area) co-expressing Pdgfra, Pdgfrb, and Cxcl12. Frequencies among total SVF are indicated.

