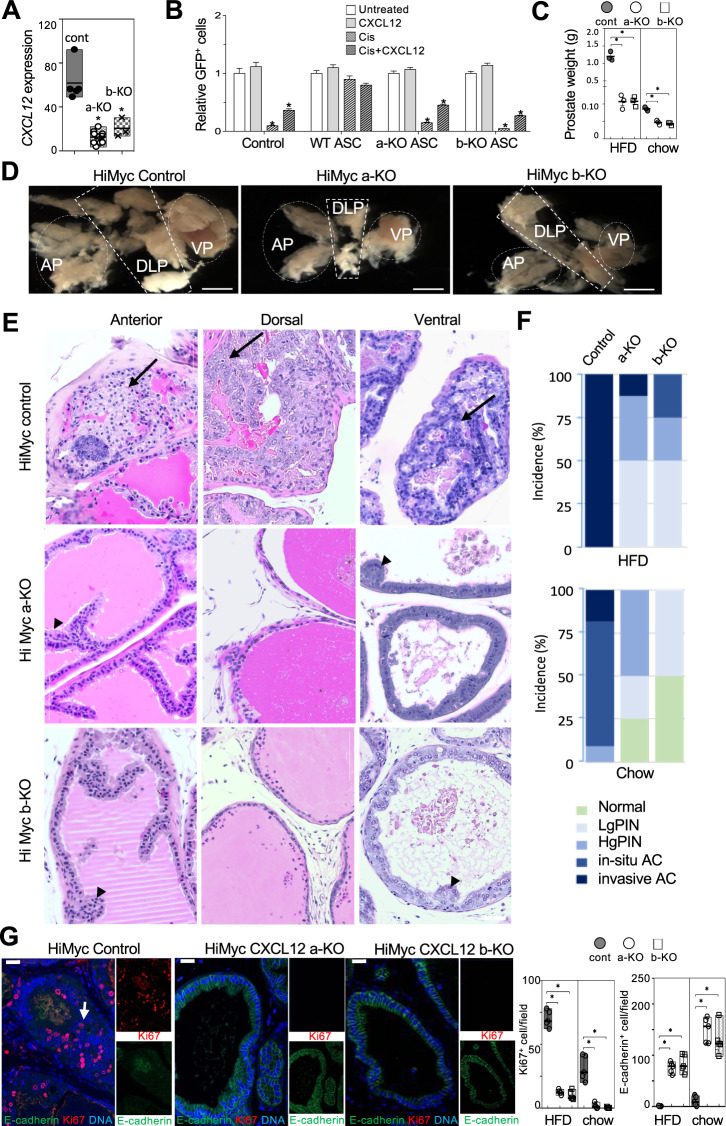
Fig. 4. CXCL12 knockout in stroma suppresses tumor growth and EMT.
A RT-PCR analysis of CXCL12 expression, normalized to 18S RNA, in periprostatic WAT of 6-month-old control HiMyc (cont, N = 5), HiMyc;PDGFRa-Cre;CXCL12flox/flox (a-KO, N = 10) and HiMyc;PDGFRb-Cre;CXCL12flox/flox (b-KO, N = 3) mice raised on HFD. *P < 0.01 (Student’s t test). B Quantification of GFP + LNCaP cells, cultured with ASC from chow-fed HiMyc-negative WT, a-KO, and b-KO mice or without ASC (Control) in medium containing 0.2 mg/ml CXCL12 and/or cisplatin (Cis) where indicated. Cell numbers are normalized to “Untreated” for Control and each ASC type. N = 5 (independent view field counts); *P < 0.01 (Student’s t test) compared to no treatment control. C Prostate weights (all lobes combined) in 6-month-old control HiMyc (cont), a-KO HiMyc and b-KO HiMyc mice raised on HFD or chow. N = 3 mice; *P < 0.05 (Student’s t test). D Representative urinary tracts from 6-month-old mice raised on HFD showing lower tumor burden (prostate size) in a-KO HiMyc and b-KO HiMyc mice, compared to control HiMyc mice. Anterior (AP), dorsolateral (DLP), and ventral (VP) prostate lobes are indicated. E H&E stainings of indicated prostate lobes from 6-month-old mice raised on HFD. Arrows: adenocarcinoma observed in all lobes of control HiMyc mice. Arrowheads: PIN. F Quantification of pathology in prostates of control HiMyc (N = 10) and CXCL12 a/b-KO HiMyc (N = 4–8) mice raised on HFD versus control HiMyc (N = 11) and CXCL12 a/b-KO HiMyc (N = 12) mice raised on chow. Graphs show % of prostates with only normal glands and those in which low-grade PIN (LgPIN), high-grade PIN (HgPIN), in situ adenocarcinoma (AC) or invasive AC was detected. G IF on sections of ventral prostate of 6-month-old HiMyc mice raised on HFD reveals proliferation (Ki67+) in tumor cells (arrow) lacking E-cadherin. In contrast, a-KO HiMyc and b-KO HiMyc mice have E-cadherin+ epithelium. Quantification of IF data (based on counts from N = 5 view fields) from mice raised on chow and HFD is graphed on the right. *P < 0.05 compared to control (Student’s t test). Scale bar = 100 µm.

