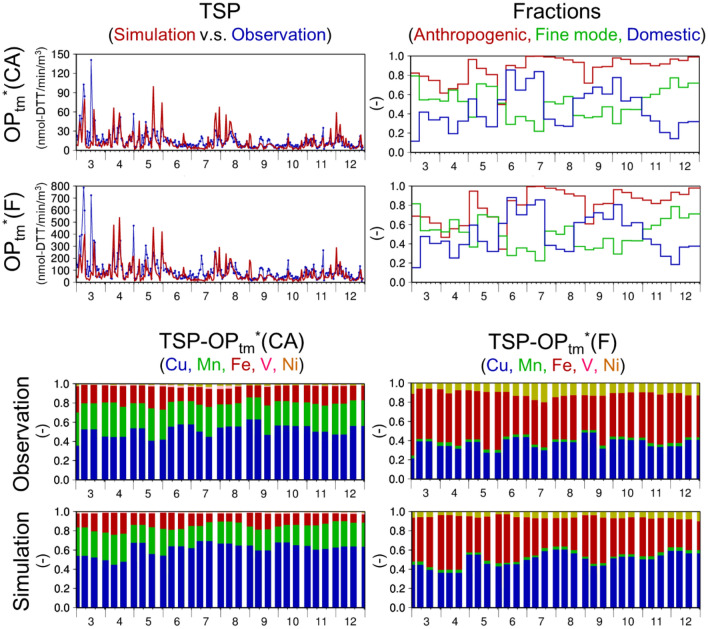
Figure 2.
Temporal variations in the daily OPtm*(CA) and OPtm*(F) and fractions of anthropogenic vs natural compounds, fine vs coarse particles, domestic vs transboundary contributions, and DTT-active elements. Temporal variations in (upper-left panels) the daily OPtm*(CA) and OPtm*(F) based on (red) the simulated (D01) and (blue) observed transition metals in TSP (nmol-DTT min−1 m−3), (upper-right panels) 10-d mean simulated (D02) fractions of (red) anthropogenic compounds to the total compounds, (green) anthropogenic fine-mode particles to anthropogenic total particles, and (blue) anthropogenic domestic contributions to the total OPtm*(CA) and OPtm*(F), (lower-left panels) relative contributions of each metal to the observed and simulated OPtm*(CA) and (lower-right panels) same as the lower-left panels but for OPtm*(F) at Yonago. Note that the simulated concentration of TSP is equivalent to the simulated PM10 concentration.

