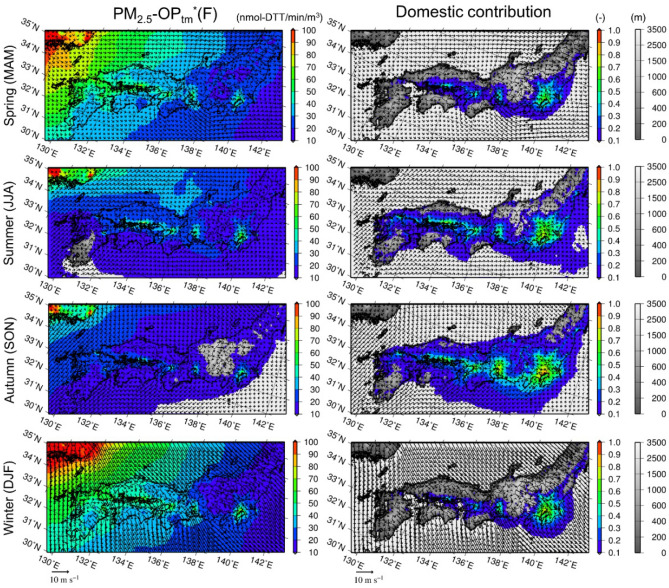
Figure 4.
Seasonal mean surface anthropogenic PM2.5-OPtm*(F) and its domestic contributions. Seasonal mean (left) surface air concentrations of anthropogenic PM2.5-OPtm*(F) (nmol-DTT min−1 m−3) and (right) its domestic contributions over D02 in (top to bottom) the spring, summer, autumn, and winter of 2013. The model terrestrial elevations are depicted in grayscale under the various colors. The map was generated using the Generic Mapping Tools v4.5.7 (https://www.generic-mapping-tools.org).

