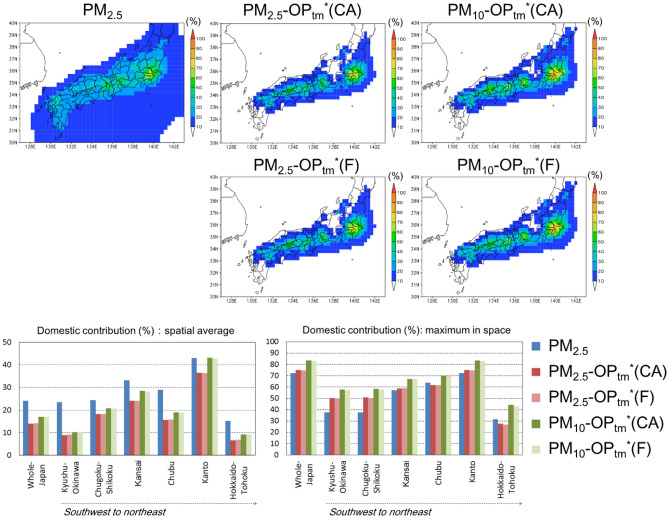
Figure 5.
Annual mean domestic contributions of PM2.5 and OPtm*(F). (Top five panels) The annual mean domestic contributions of PM2.5 simulated by Kajino26 and anthropogenic OPtm*(CA) and OPtm*(F) in PM2.5 and PM10 simulated in this study. (Bottom two panels) (%) (left) spatially averaged values and (right) maximum values in space of the domestic contributions over all of Japan and the six regions, as shown in Fig. 1. The map was generated using the Grid Analysis and Display System (GrADS) v2.0.2,
available at http://cola.gmu.edu/grads.

