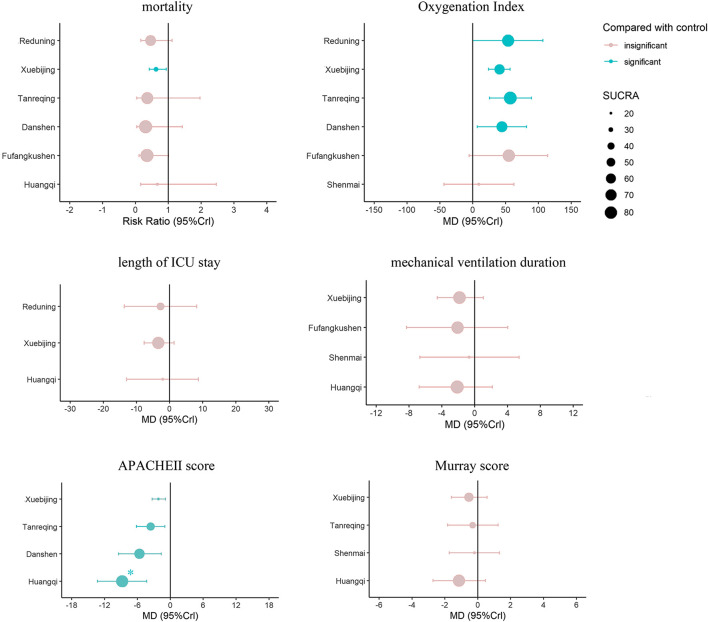
FIGURE 6.
Composite forest plot of pairwise comparison and the SUCRA: The forest plot shows the RR (95% CrI) and MD (95% CrI) of each intervention compared to the control group based on Bayesian network meta-analysis. There is no significant difference between the intervention and control group if the range of 95%CrI contains the invalid line. Larger dots indicate larger SUCRA values. *: There was a statistical difference between Huangqi and Xuebijing (MD = -6.64, 95%CrI: 11.32, -1.98) in the pairwise comparison.

