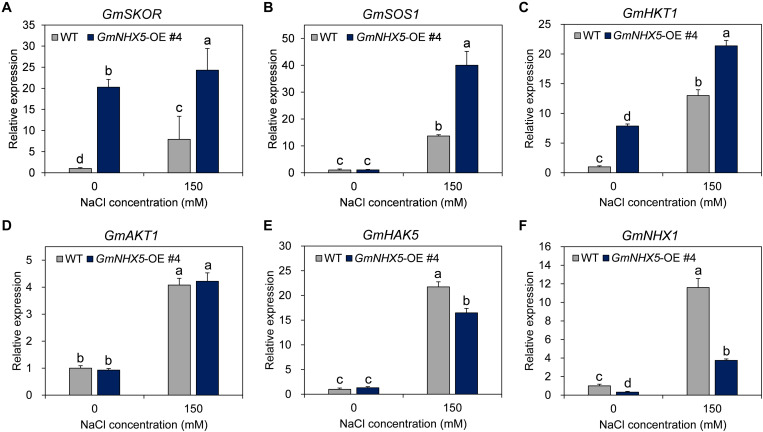
FIGURE 8.
Expression analysis of salt tolerance related genes. The relative transcription level of GmSKOR (A), GmSOS1 (B), GmHKT1 (C), GmAKT1 (D), GmHAK5 (E), and GmNHX1 (F) were detected in the GmNHX5-overexpressing T3 soybean seedlings 6 h after 0 or 150 mM NaCl treatment, and normalized to the values measured in WT exposed to 0 mM NaCl. Actin was used as a reference gene. Each value represents the mean ± SE of three biological replicates. Different letters indicate significant difference (P < 0.05 by one-way ANOVA/Duncan).

