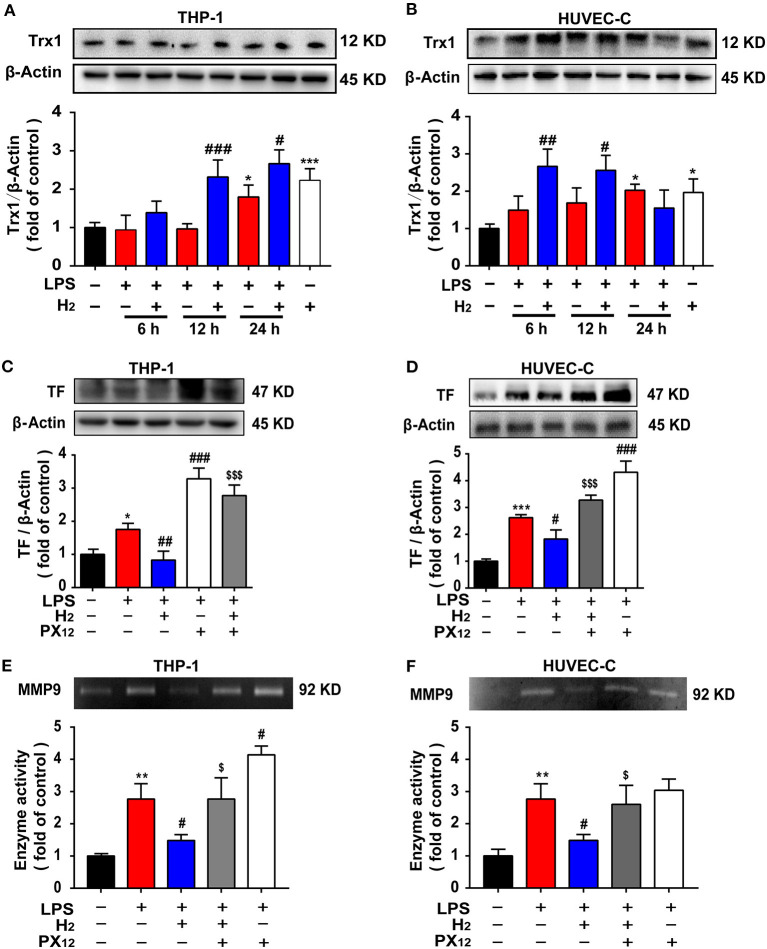
Figure 7.
The expression of TF and MMP9 are closely related to Trx1. LPS (0.3 μg/ml) was used to establish the endotoxemia model in HUVEC-C cells. LPS (1 μg/ml) was used to establish the endotoxemia model in THP-1 cells. H2 (65% H2) was used to treat both HUVEC-C and THP-1 cells. PX12 (2 μM) was used in HUVEC-C cells as an inhibitor of Trx1. PX12 (8 μM) was used in THP-1 cells as an inhibitor of Trx1. Effect of hydrogen on the expression of Trx1 in THP-1 (A) and HUVEC-C cells (B) were measured by western blot analysis and the densitometry values were normalized to β-actin at 6, 12, and 24 h (n = 3 in each group). Effect of hydrogen and PX12 on the expression of TF in THP-1 (C) and HUVEC-C cells (D) at 12 h were measured by western blot analysis and the densitometry values were normalized to β-actin (n = 3 in each group). Effect of hydrogen and PX12 on the expression of MMP-9 in THP-1 (E) and HUVEC-C cells (F) were measured by gelatin zymography and the densitometry values were normalized at 12 h (n = 3 in each group). Significant differences were revealed following one-way ANOVA (*P < 0.05, **P < 0.01, ***P < 0.001 vs. Control; #P < 0.05, ##P < 0.01, ###P < 0.001 vs. LPS-treated group; $P < 0.05, $$$P < 0.001 vs. LPS + H2 group; Bonferroni post-hoc tests).

