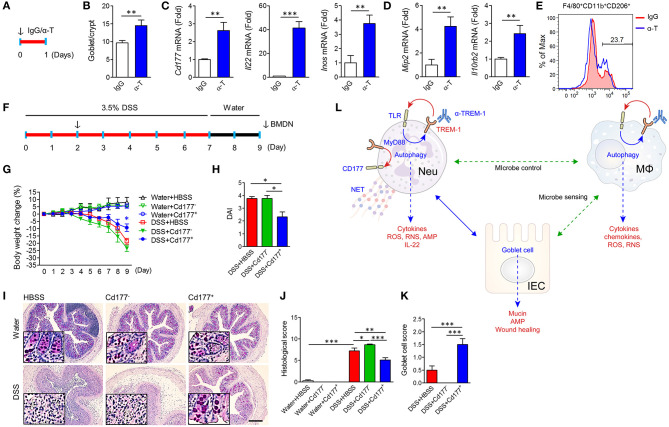
Figure 7.
α-TREM-1-induced CD177+ neutrophils confer anticolitic effects. (A–E) α-TREM-1 was intraperitoneally injected to C57BL/6 mice and the next day, colons were isolated for analysis. (A) Experimental diagram. The arrow indicates the point at which IgG- or α-TREM-1 was administered (20 μg/mouse). (B) Goblet cell score. (C,D) Expression of Cd177+ neutrophil- (C: Cd177, Il22, and Inos) and macrophage-specific (D: Mip2 and Il10rb2) genes in the colon. Each data represents the mean of duplicate real-time RT-PCR (n = 4). (E) Flow cytometric analysis of M2 (CD206+) in macrophage (F4/80+Cd11b+) populations among lamina propria mononuclear cells. (F–J) Bone marrow-derived neutrophils were isolated, treated with IgG or α-TREM-1 for 24 h, and sorted by FACS into CD177+ and CD177−, which were then intraperitoneally injected (1 × 10⁶ cells, arrow) into recipient mice 2 days after DSS treatment. (F) Experimental design for neutrophil transfer. (G) Body weight change. (H) Disease activity index. (I) Representative sections of periodic acid-Schiff staining. Scale bar, 200 μm. (J) Histological score. (K) Goblet cell score. (L) Schematic representation of anticolitic effects of α-TREM-1. Data are expressed as means ± S.E.M. (n = 4/groups). α-T, treated with α-TREM-1; AMP, antimicrobial peptides; IgG, treated with control antibody; HBSS, injected with Hank's balanced salt solution; IEC, intestinal epithelial cell; IgG, treated with control antibody; MΦ, macrophage; Neu, neutrophil; RNS, reactive nitrogen species; ROS, reactive oxygen species. Statistical significance was assessed using Student t-test (B–D) or one-way ANOVA followed by Tukey post-test (G,H,J,K). *P < 0.05, **P < 0.01, ***P < 0.005.

