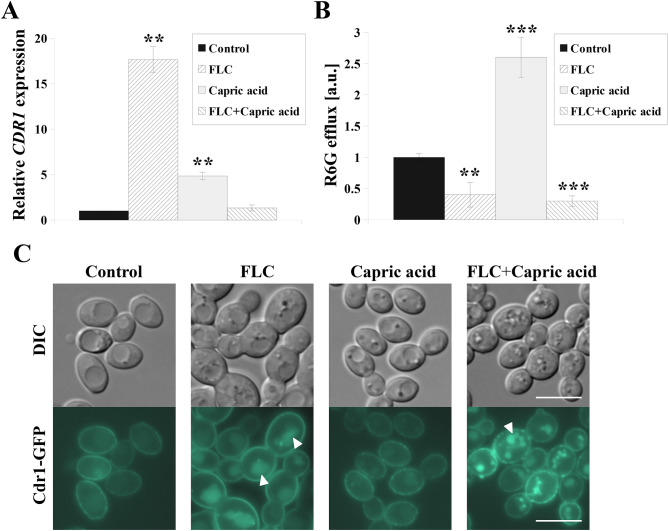
Figure 2.
(A) Relative CDR1 gene expression in the C. albicans CAF2-1. Gene expression levels are reported as means ± SD of 2−ΔΔCT values (n = 3), normalized to 1 for control conditions. (B) Cdr1p-dependent rhodamine 6G (R6G efflux) in the C. albicans CAF2-1 normalized to = 1 for untreated control; means ± SD, n = 3. (C) Fluorescence micrographs of the subcellular localization of the Cdr1-GFP protein in the C. albicans KS052 (CAF2-1 CDR1-GFP). For the experiments C. albicans was grown for 8 h in the following conditions: control without antimicrobial agents, FLC—treated with fluconazole 4 μg/mL; Capric acid—treated with capric acid 45.3 μg/mL; FLC + Capric acid—simultaneously treated with fluconazole 4 μg/mL and capric acid 45.3 μg/mL. Statistical analysis was performed by comparing the CDR1 expression level (A) or R6G fluorescence intensity (B) of cells treated with antimicrobial agent(s) with the corresponding untreated control. Scale bar = 5 μm. Statistical significance was presented as follows: **p < 0.01; ***p < 0.001.

