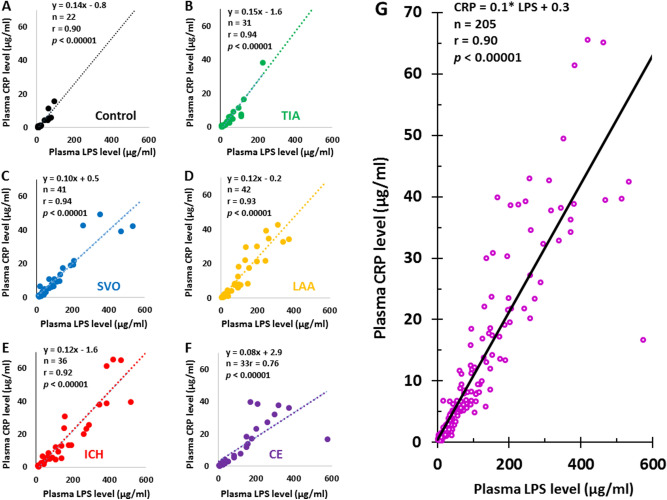
Figure 2.
Pearson Correlation Analysis for plasma LPS levels and plasma CRP levels in different causes of stroke, TIA, and controls. The plasma LPS levels correlated with plasma CRP levels in controls (A), TIA (B), SVO stroke (C), LAA stroke (D), ICH (E), CE stroke (F) and for all subjects (G). Note that the intercepts of LPS trendlines on Y axis (CRP levels) in control, TIA, SVO stroke, LAA stroke, ICH stroke and CE strokes were − 0.8, − 1.6, 0.5, − 0.2, − 1.6 and 2.9 µg/ml, respectively (A–F). The intercept of LPS trendline on Y axis (CRP levels) for all 205 subjects was + 0.3 as indicated in (G). LPS lipopolysaccharide, CRP C-reactive protein, CE cardioembolic, LAA large artery atherosclerosis, SVO small-vessel occlusion, ICH intracerebral hemorrhagic, TIA transient ischemic attack.

