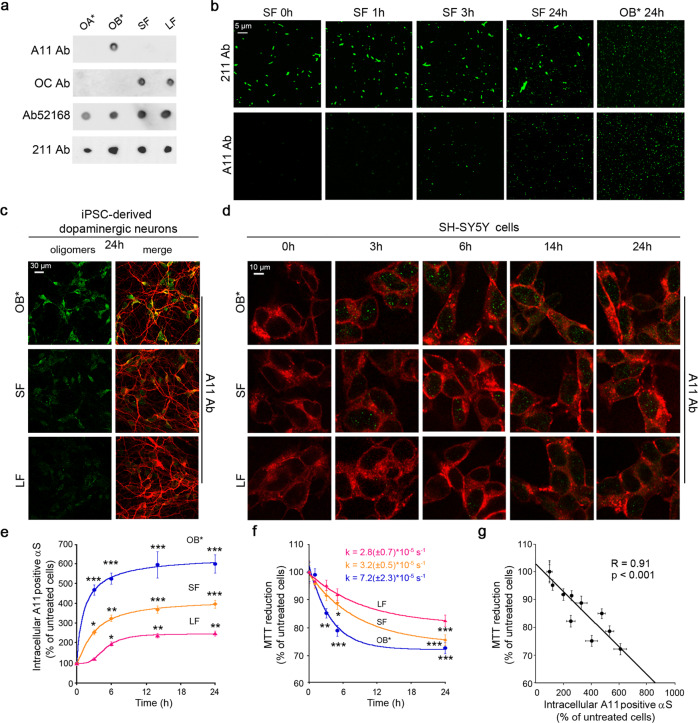
Fig. 4. αS fibrils gradually release oligomers that are ultimately responsible for their toxicity.
a Dot-blot analysis of αS species probed with conformational specific antibody A11 (AHB0052, Thermo Fisher Scientific), OC (AB2286, Sigma-Aldrich), conformation-insensitive polyclonal anti-αS antibody (ab52168, Abcam) and conformation-insensitive monoclonal 211 antibody specific for human αS (sc12767, Santa Cruz Biotechnology). b Representative confocal microscope images showing SF (at 0.3 μM) incubated in CM without cells in wells containing a glass coverslip for 0–24 h at 37 °C. Representative images of OB* incubated for 24 h were also shown as positive control. The green-fluorescent signals derive from the staining with mouse monoclonal 211 anti-αS antibodies and rabbit anti-oligomer A11 polyclonal antibodies, in the first and second rows, respectively, and then Alexa-Fluor 514-conjugated anti-mouse or anti-rabbit secondary antibodies (three independent experiments with one internal replicate). c Representative confocal scanning microscope images showing human iPSC-derived dopaminergic neurons treated for 24 h with OB*/SF/LF at 0.3 µM. Red and green fluorescence indicates mouse anti-MAP-2 antibodies (ab11267, Abcam) and the A11-positive prefibrillar oligomers, respectively. d Representative confocal scanning microscope images showing the median sections of SH-SY5Y cells treated for the lengths of time indicated with OB*/SF/LF at 0.3 µM. Red and green fluorescence indicates the cell membranes labeled with WGA and the A11-positive prefibrillar oligomers, respectively (three independent experiments with four internal replicates). e Kinetic plots reporting A11-intracellular fluorescence following the addition of 0.3 μM of the indicated αS species to SH-SY5Y cells. The continuous lines through the data represent the best fits to exponential and sigmoidal functions (see “Methods”), for OB*, SF, and LF, respectively. f Kinetic plots reporting the MTT reduction versus time elapsed following addition of 0.3 μM of the indicated αS species to SH-SY5Y cells. g Dependence of MTT reduction on the penetration of A11-positive αS in SH-SY5Y cells treated with αS species. MTT reduction values reported in (f) plotted against the αS-derived intracellular fluorescence values reported in (e) of cells treated with OB*/SF/LF at the corresponding times. Experimental errors are S.E.M. (n = 3 with four internal replicates in panel (e); n = 4 with three internal replicates in panel (f); n = 3 with four internal replicates and n = 4 with three internal replicates for MTT reduction and intracellular A11-positive aS, respectively, in panel (g). Samples were analyzed by one-way ANOVA followed by Bonferroni’s multiple comparison test relative to untreated cells (in panels e and f, *P < 0.05, **P < 0.01, ***P < 0.001; in panel g, P < 0.001). A total of 200–250 cells (e) and 150,000–200,000 cells (f) were analyzed per condition.

