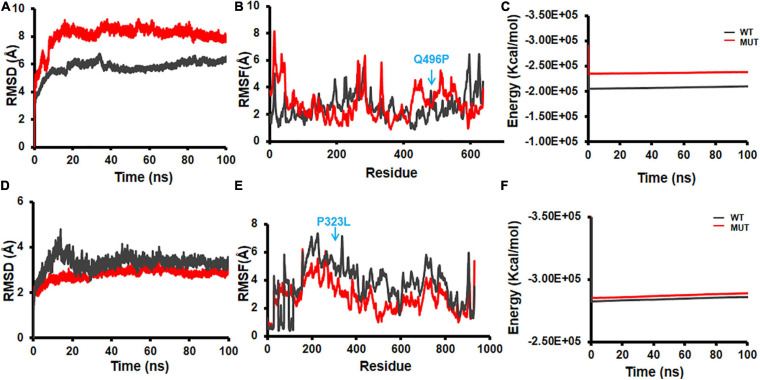
FIGURE 10.
Molecular dynamics (MD) simulation of wild-type and mutant non-structural protein (NSP) complex with human interactor proteins. (A) Root mean square deviation (RMSD) plot, (B) root mean square fluctuation (RMSF) plot, and (C) energy plot for complex of NSP2 with EIF4E2. (D) RMSD plot, (E) RMSF plot, and (F) energy plot for complex of NSP12 with peptidyl-prolyl isomerase like-3 (PPIL3). The mutant site is marked by arrows in (B,E).

