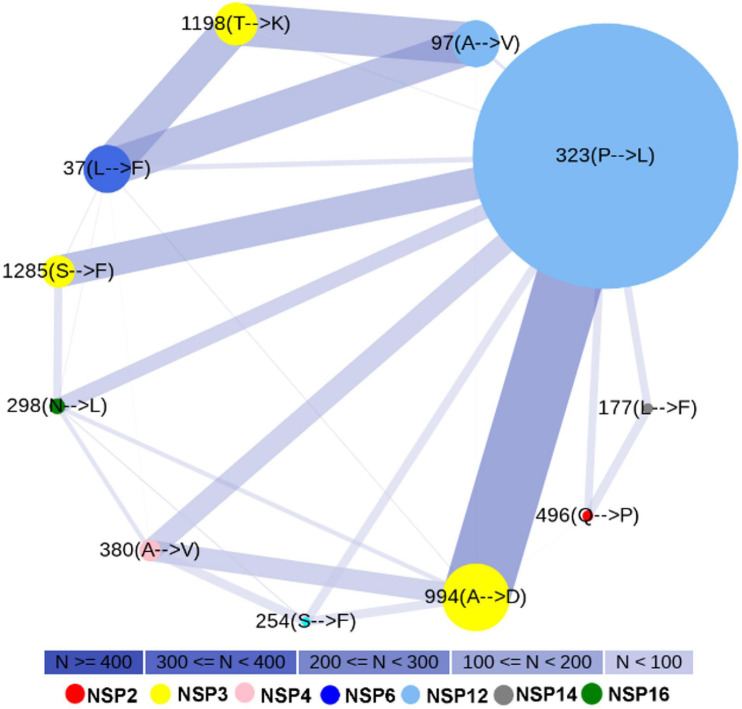
FIGURE 2.
Co-occurrence of most frequent mutations. Node color indicates different non-structural proteins (NSPs). Node size indicates mutation frequency. The smallest node corresponds to 62 sequences, while the largest node corresponds to 1,834 sequences. Edge width and color represent the number of sequences (N) where the mutations have co-occurred.

