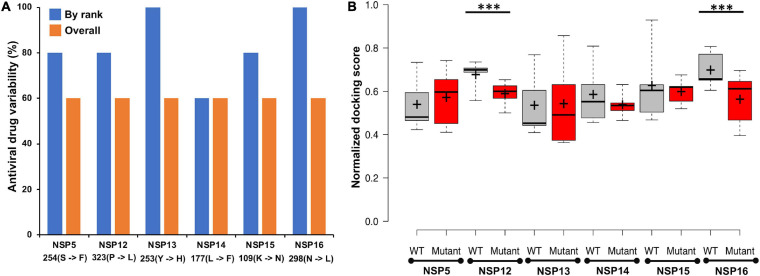
FIGURE 7.
(A) The percentage of antiviral drug variability within the best five predicted antivirals against wild-type (WT) and mutant non-structural proteins (NSPs). “By rank” variability was calculated via matching the same drug at the same ranked position within the top five scored drugs, whereas “overall” match was calculated by finding the commonly appearing antiviral drugs within the top five predicted drugs against WT and mutant, respectively. (B) The boxplot representation of the docking score of top five ranked antiviral drugs against the wild-type and mutant NSPs, respectively. Median and mean of the scores are shown as line (–) and plus sign (+), respectively. Statistically significant differences (p-val ≤0.01) of docking scores are marked with ***.

