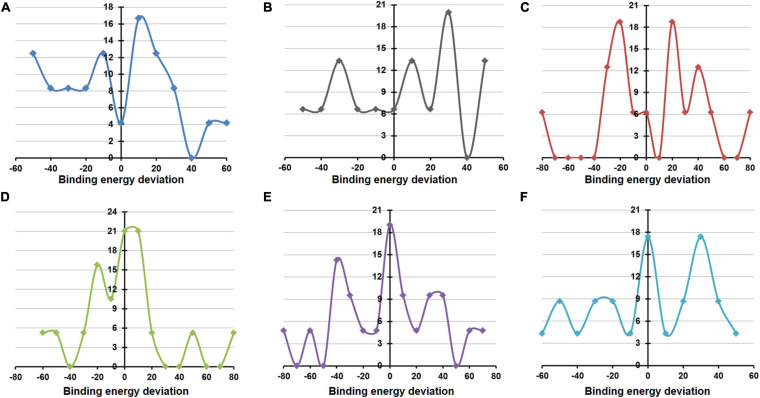
FIGURE 8.
Deviation in binding/docking free energy between pre and post simulation derived drug–non-structural protein (NSP) complexes. (A–F) The fraction of screened drugs and their average binding energy deviation for NSP5, NSP12, NSP13, NSP14, NSP15, and NSP16. The X-axis represents the percentage of average binding energy deviation, and the Y-axis represents the fraction of screened molecules.

