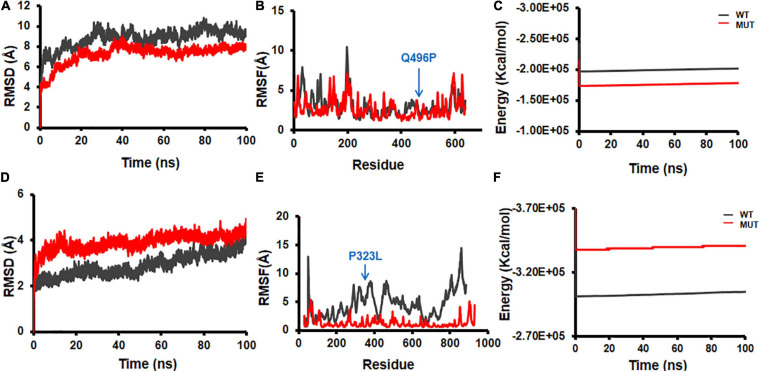
FIGURE 9.
Molecular dynamics (MD) simulation of wild-type (WT) and mutant structures. (A) Root mean square deviation (RMSD) plot, (B) root mean square fluctuation (RMSF) plot, and (C) energy plot for NSP2 WT and 496(Q→P) mutant. (D) RMSD plot, (E) RMSF plot, and (F) energy plot for complex of NSP12 and 323(P→L) mutant. The mutant sites are marked by blue arrows in (B,E).

