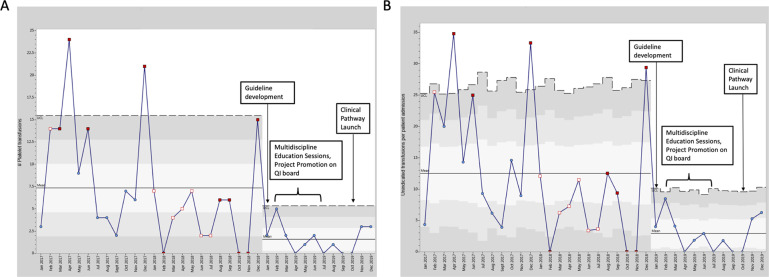
Fig. 2. Significant decreases in non-indicated platelet transfusions after project start on SPC analysis.
Special cause variation shows significant change. A Decreased number of non-indicated platelet transfusions/month after project start from 7.3 to 1.6 on SPC C-chart analysis. B Rate of non-indicated transfusions per 100 patient admissions decreased from 12.5 to 2.9 after project start on U-chart analysis. For both A and B, the rule used to determine special cause variation was 8 or more points below the centerline.

