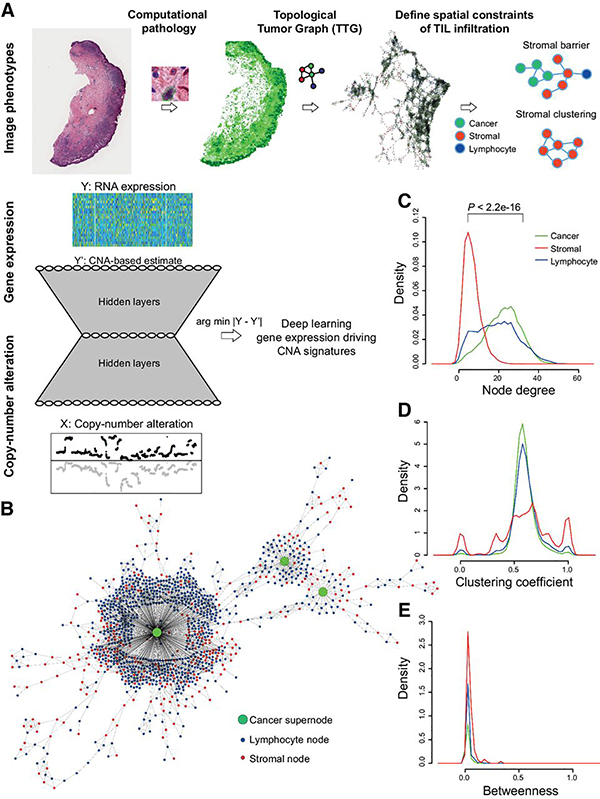
Figure 1.
Computational pipeline schema. A, Schema of automated computational pathology pipeline to analyze H&E slides classified at single-cell resolution and converted to TTGs. TTG-derived tumor phenotypes were integrated with omic data using a convolutional neural network with an hourglass-shaped architecture. This network was designed to learn a sparse representation of CNAs that drive gene expression changes. B, Illustration of a part of a TTG from a whole-tumor section, with cancer cluster summarized into a supernode. C–E, Cell-type-specific distribution of node degree, clustering coefficient, and betweenness. P value from t test.

