
Figure 3:
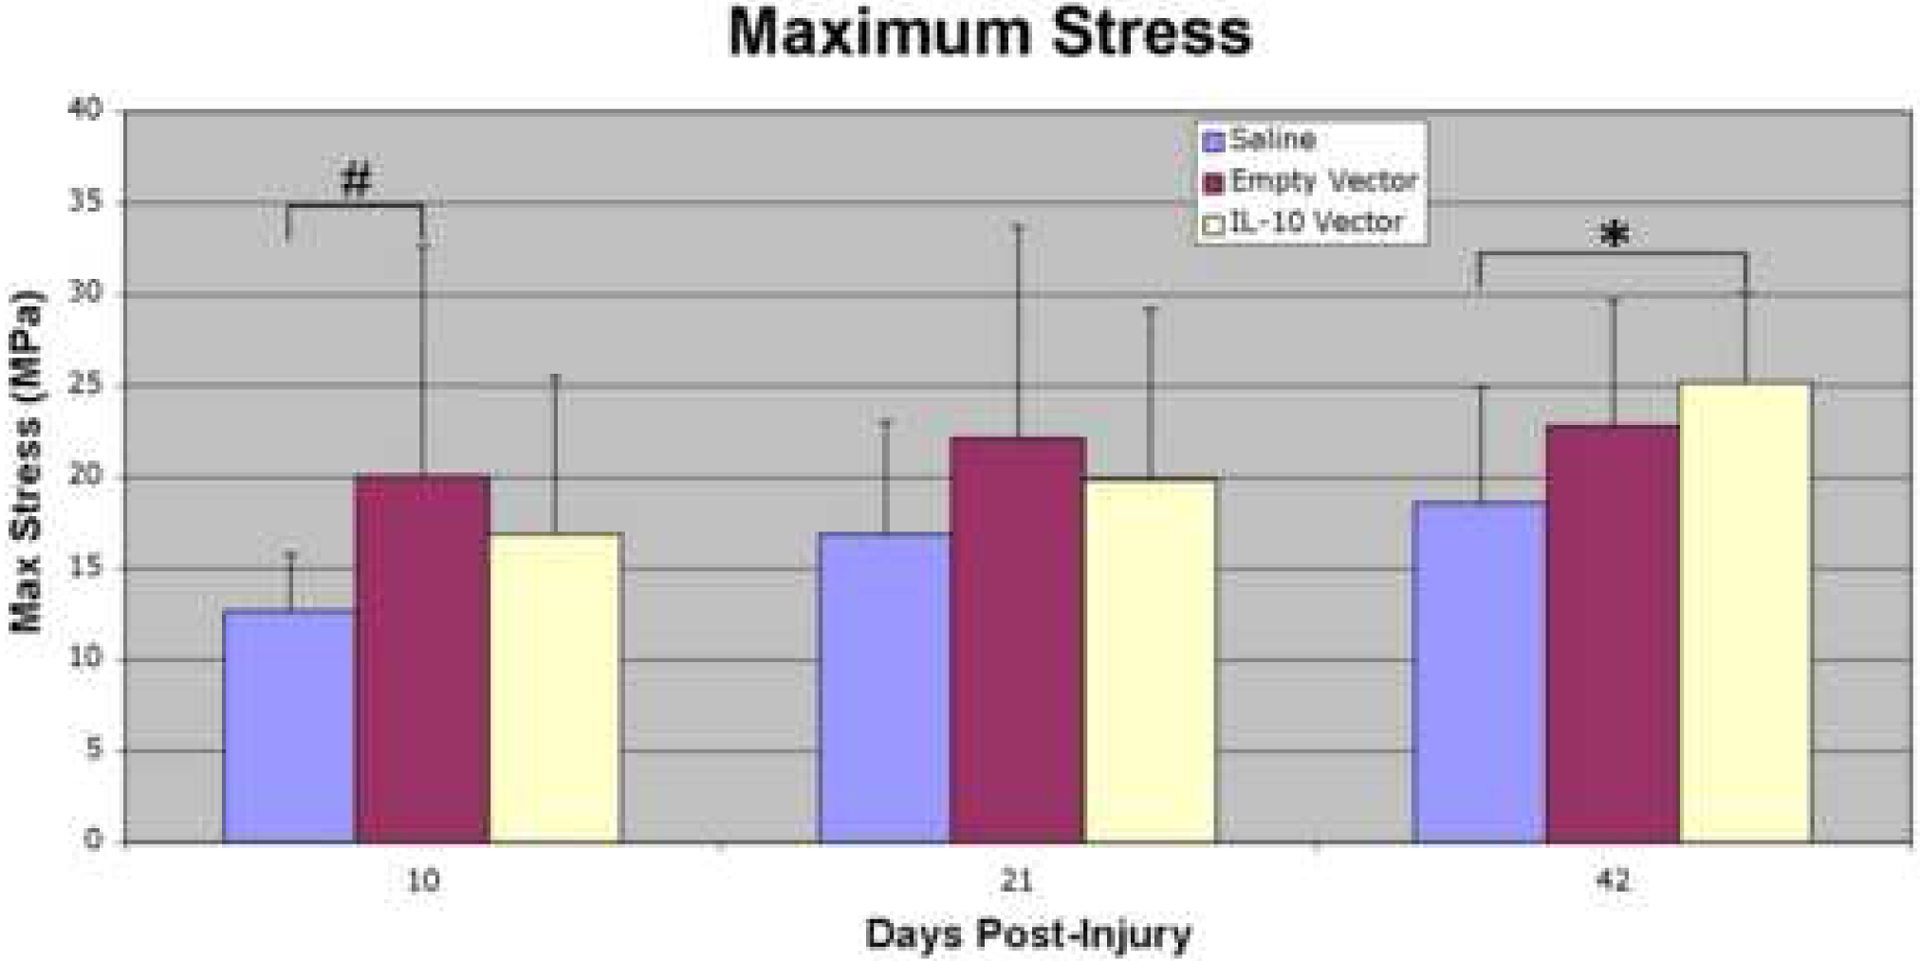
Maximum stress (MPa) at 10, 21, and 42 days post-injury. The empty vector group showed a trend toward increased maximum stress at day 10 post-injury relative to the saline controls, and maximum stress was significantly increased in the IL-10 group at day 42 post-injury relative to the saline controls. The asterisk (*) indicates a significant difference (p≤0.05) and the pound sign (#) denotes a trend (p≤0.1) when comparing between treatment groups within a post-injury time point.