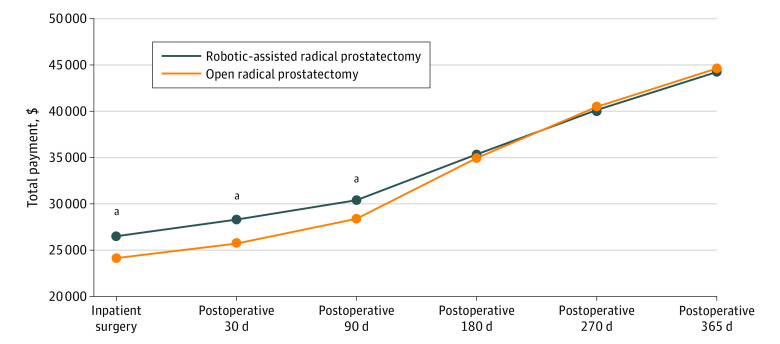
Figure 2. Time Series Graphics for the Inverse Probability of Treatment Weighting–Adjusted Payment.
Total cost was calculated by adding facility and professional payments during the inpatient stay (index surgery) and all health services–related costs within 1 year after discharge, including inpatient, outpatient, and prescription drug services cumulatively.
aP < .001.

