Fig. 1.
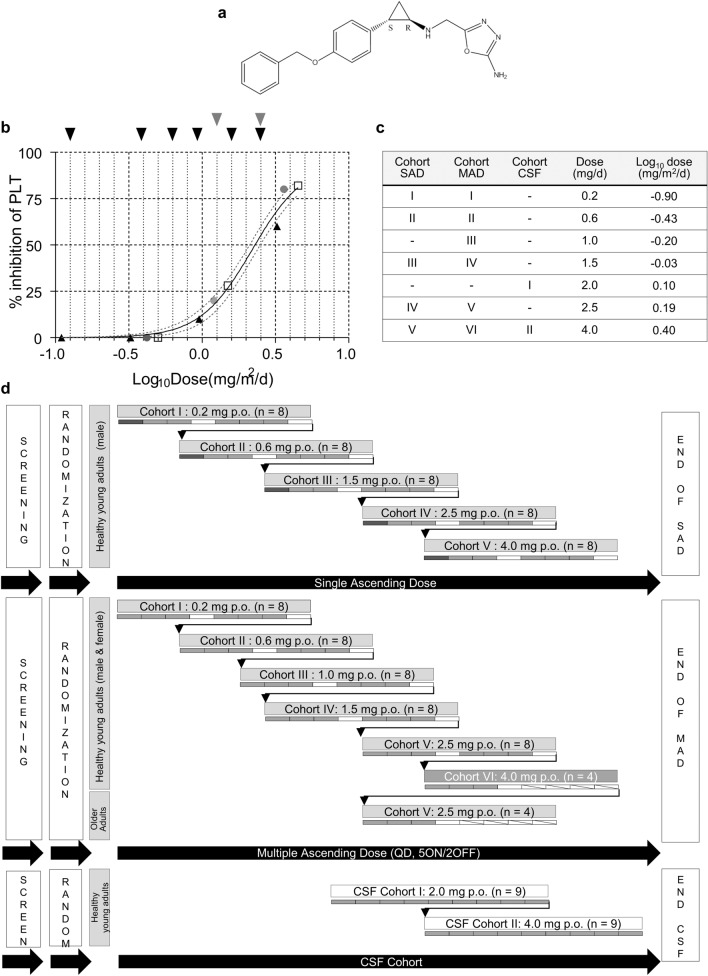
Clinical trial design. a Chemical structure of vafidemstat. b Impact of vafidemstat on platelet levels in nonclinical species, represented as % inhibition compared with control animals. All values are expressed as mg/m2/day to allow for direct comparison. Differences in administration (once daily by oral gavage in rats and dogs vs. drinking water in mice) were accounted for. Doses in mg/kg/day were converted to mg/m2/day by multiplication with the Km factor for each species (3, 6, 20, 37 for mouse, rat, dog, human, respectively). Black triangles indicate the SAMP8 efficacy studies in mouse; gray circles indicate the 28-day toxicity in rats; white squares indicate the 28-day toxicity in dogs; black arrows represent the doses chosen for the SAD and MAD cohorts; gray arrows represent those for the CSF cohorts in the phase I trial. The maximum recommended starting dose was 0.2 mg. c Clinical trial doses per cohort. d Study design of the SAD, MAD, and CSF cohorts. Dark gray rectangle indicates the sentinel subject, light gray rectangles indicate subjects in active treatment; white rectangles indicate subjects receiving placebo. CSF cerebrospinal fluid, MAD multiple ascending dose, p.o. oral administration, PLT platelet, QD once daily, SAD single ascending dose

