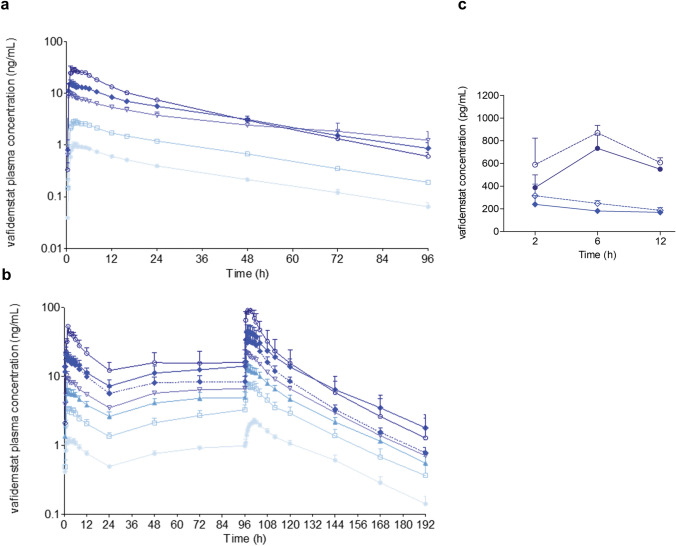
Fig. 3.
Vafidemstat pharmacokinetics. (a) Plasma concentrations after single and (b) multiple ascending doses in healthy young (full lines) and older adult (dotted line) subjects. Light blue circles 0.2 mg; white squares 0.6 mg; light blue triangles 1 mg; white triangles 1.5 mg; blue diamonds 2.5 mg; white circles 4 mg. Data are presented as mean and standard error of the mean. Volunteers analyzed at each datapoint, n = 6 except for MAD 4 mg, n = 3. (c) Cerebrospinal fluid (full lines) and plasma (unbound, dotted lines) concentrations after a single dose of 2 mg (diamonds) or 4 mg (circles)

