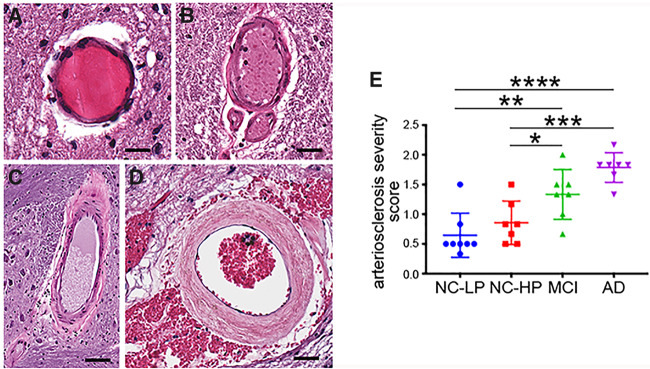
FIGURE 5.
Pontine arteriolosclerosis severity across the diagnostic groups. Representative images of vessels graded as stage 0 (A), stage 1 (B), stage 2 (C), or stage 3 (D), according to arteriolosclerosis severity by an observer blinded to diagnosis, as described in “Materials and Methods.” (E) Pontine arteriolosclerosis severity was similar in NC-LP and NC-HP cases. In contrast, pontine arteriolosclerosis was significantly more severe in MCI and AD cases compared with NC-LP, as well as NC-HP. *p < 0.05, **p < 0.01; ***p < 0.001; ****p < 0.0001 via 1-way ANOVA with Bonferroni correction. Scale bars = 50 μm (stage 0), 70 μm (stage 1), 100 μm (stage 2), and 90 μm (stage 3).

