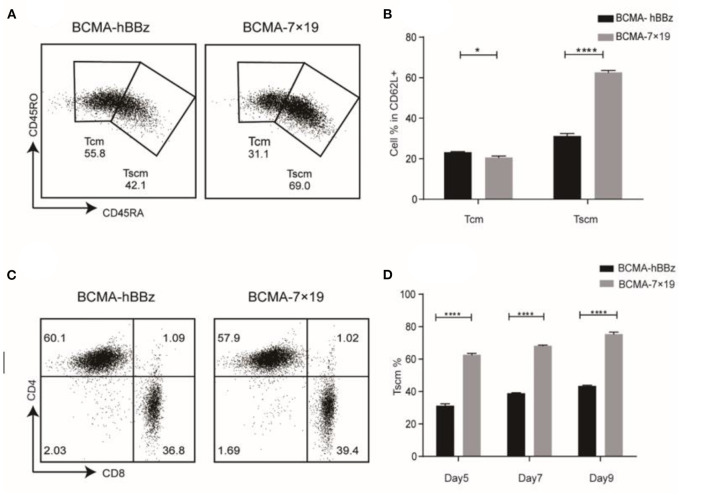
Figure 2.
Phenotype of CAR-T cell. (A) Expression of CD45RA and CD45RO on CAR-T cells subsets in CD62L+ cells by flow cytometry. Tcm (CD62L+CD45RO+CD45RA−), Tscm (CD62L+CD45RO−CD45RA+). (B) Statistical chart of subset distribution. (C) CD4/CD8 ratios of CAR-T cells were analyzed by flow cytometry. (D) Change of Tscm ratio at the indicated time-points. P-value was calculated by two-way ANOVA. *P < 0.05, ****P < 0.0001.

