Figure 3.
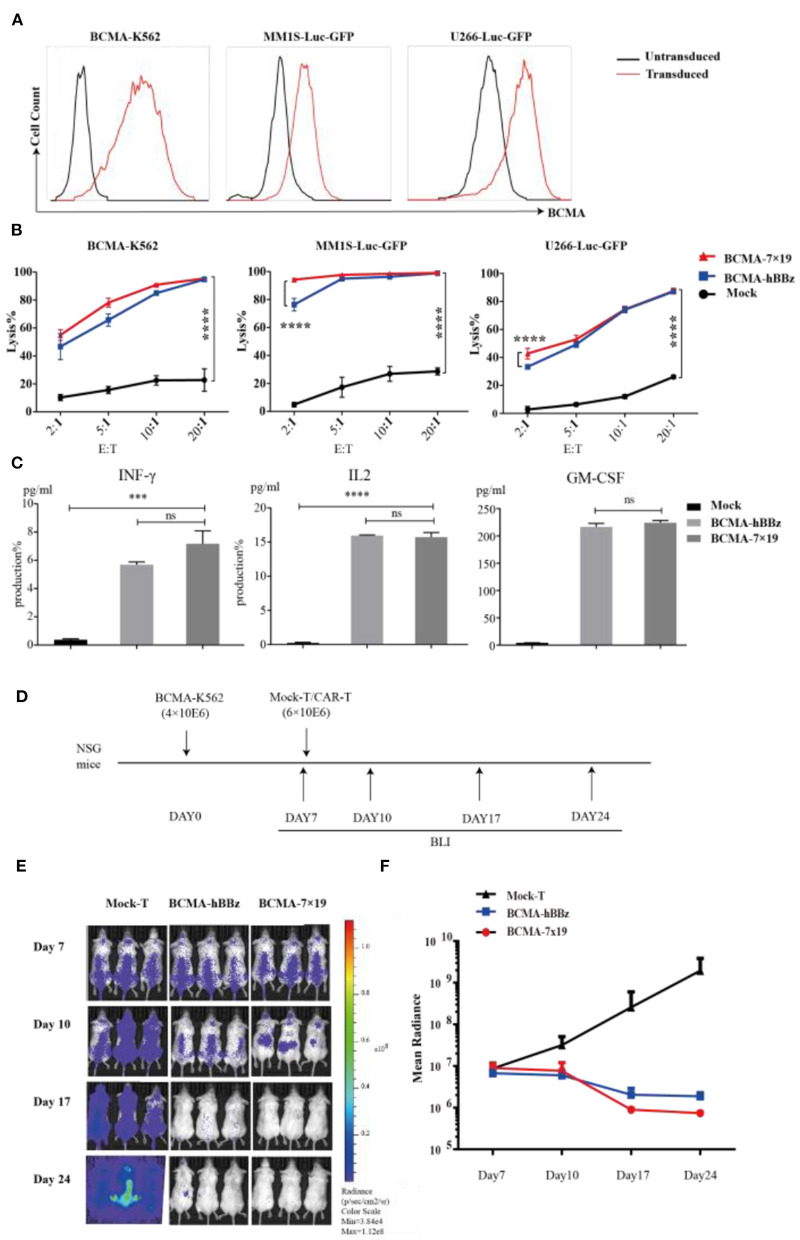
Cytotoxicity analysis of BCMA-hBBz and 7 × 19 CAR-T cells in vitro and in vivo. (A) MM1S-Luc-GFP, U266-Luc-GFP and BCMA-K562 cell lines stably expressing BCMA and luciferase. (B) CAR-T cells and target tumor cells were co-incubated for 4 h at the indicated E:T ratios. Cytotoxicity assay with BCMA-K562 (left), MM1S-Luc-GFP (middle) and U266-Luc-GFP cells as targets (right). Differences between groups were determined using two-way ANOVA. Mean ± SD, ****p < 0.0001. (C) Cytokine release by CAR-T cells in response to multiple myeloma cell lines. CAR-T or mock-T cells were incubated with MM1S-Luc-GFP cells at 1:1 for 24 h, IL2 (left), IFN-γ (middle) and GM-CSF (right) were analyzed by intracellular staining or ELISA. P-value was calculated by two-tailed student t-test. ***P < 0.001. ns, not statistically significant (P > 0.05). (D) Flow chart of animal experimentation. (E). On day 0, NSG mice were injected intravenously with 4 × 10⁶ BCMA-K562 cells. On day 7, mice received 6 × 10⁶ BCMA-7 × 19 CAR-T cells (n = 3), BCMA-hBBz CAR-T cells (n = 3) or mock-T cells (n = 3). Luciferase bioluminescent imaging analysis on days 7, 10, 17, and 24. (F) Average bioluminescent signal for each group in different days [mean radiance (p/s/cm2/sr)] ±SD.

