Figure 7.
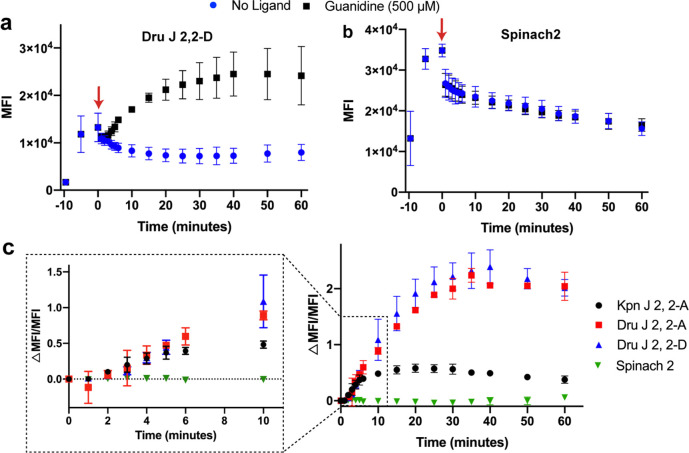
In vivo response kinetics of guanidine biosensors. Plot of average MFI values over time for cells expressing (a) Dru J 2, 2-D biosensor or (b) Spinach2. Other biosensor plots are shown in Figure S7. Water or guanidine was added at time 0 (indicated by red arrow). (c) Plot of ΔMFI/MFI values over time for cells expressing guanidine biosensors or Spinach2. The enlarged portion of the plot displays the turn-on response at earlier time points. Data shown are the average with a standard deviation of 2–3 biological replicates.

