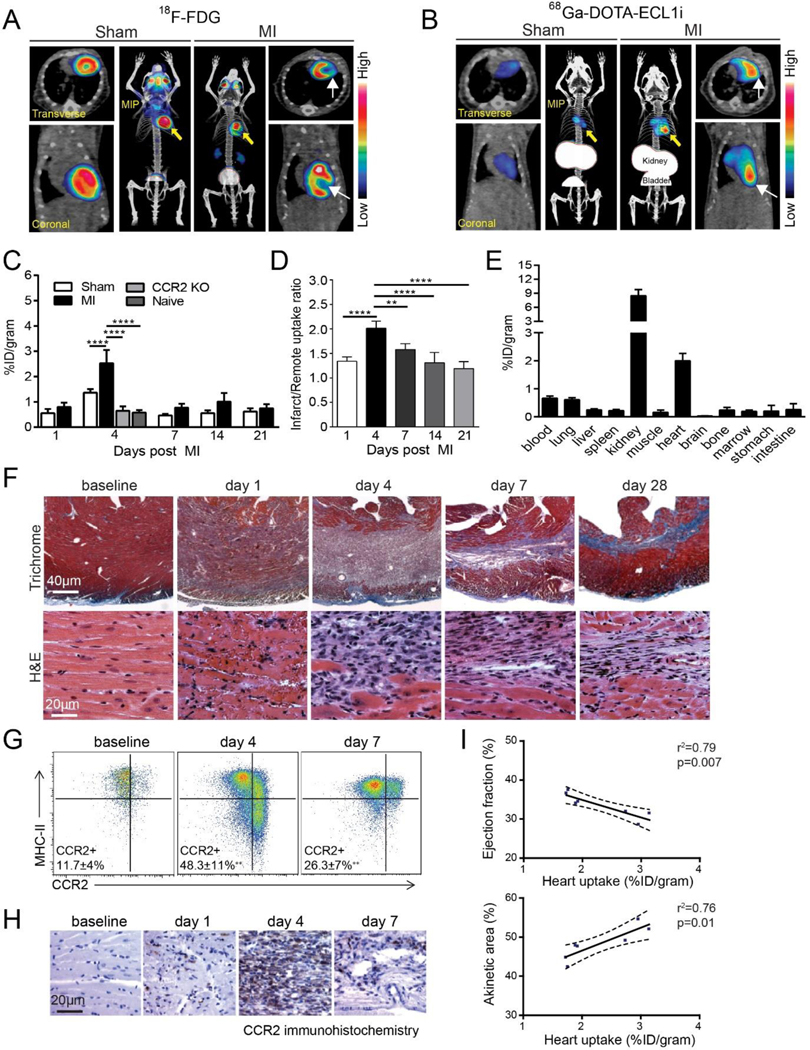
Figure 1. Positron emission tomography (PET) of 68Ga-DOTA (1,4,7,10-tetraazacyclododecane-1,4,7,10-tetraacetic acid)-ECL1i (extracellular loop 1 inverso) in a mouse model of closed-chest ischemia-reperfusion injury.
A, Representative 18F-fluorodeoxyglucose (18F-FDG) PET/CT images obtained 5 d after 90 min of ischemia-reperfusion injury identifying the infarct region in mice that underwent ischemia-reperfusion injury (myocardial infarction [MI]) compared with sham controls. Transverse, coronal, and maximal-intensity projected (MIP) views are shown, and white arrows denote the infarct area. B, Representative 68Ga-DOTA-ECL1i PET/CT images showing regional accumulation of 68Ga-DOTA-ECL1i signal in the infarct and border zone 4 d after ischemia-reperfusion injury. Transverse, coronal, and MIP views are shown. Yellow arrow identifies tracer uptake in hearts that underwent ischemia-reperfusion injury compared with sham controls. White arrows denote the infarct area as determined by 18F-FDG imaging. C, Quantitative analysis of 68Ga-DOTA-ECL1i accumulation in the hearts of naive, sham, MI, and CCR2 (C-C chemokine receptor type 2) KO (knockout) mice that underwent ischemia-reperfusion injury at the indicated time points. n=4 to 5 per experimental group. D, Regional accumulation of 68Ga- DOTA-ECL1i uptake in the infarct and remote areas of sham and MI mice over the indicated time points. E, Biodistribution of 68Ga activity 4 d after ischemia-reperfusion injury measured 1 h post-intravenous injection (tail vein) of 68Ga-DOTA-ECL1i. n=5 per experimental group. F, Trichrome and hematoxylin and eosin (H&E) staining show the evolution of fibrosis (trichrome-blue, ×40 magnification) and cell infiltration (H&E, ×200 magnification) over time in the closed-chest ischemia-reperfusion injury model. Note the dense accumulation of cells within the infarct 4 d after ischemia-reperfusion injury. Representative images from 6 independent experiments. G, Flow cytometry analysis showing accumulation of CCR2+ monocytes (CCR2+MHCIIlow) and CCR2+ macrophages (CCR2+MHC-IIhigh) 4 d after ischemia-reperfusion injury and persistence of CCR2+ macrophages 7 d after ischemia reperfusion injury compared with sham controls. H, Immunostaining showing accumulation of CCR2+ cells (brown) in the infarct region peaking at day 4 after ischemia-reperfusion injury. I, Linear regression analyses showing the relationship between 68Ga-DOTA-ECL1i heart uptake measured on day 4 after ischemia-reperfusion injury and echocardiographic assessment of LV ejection fraction and akinetic area measured on day 28 after ischemiareperfusion injury. *P<0.05, **P<0.01, ***P<0.005, ****P<0.001. MHC indicates major histocompatibility complex. Reprinted with permission from reference 34

