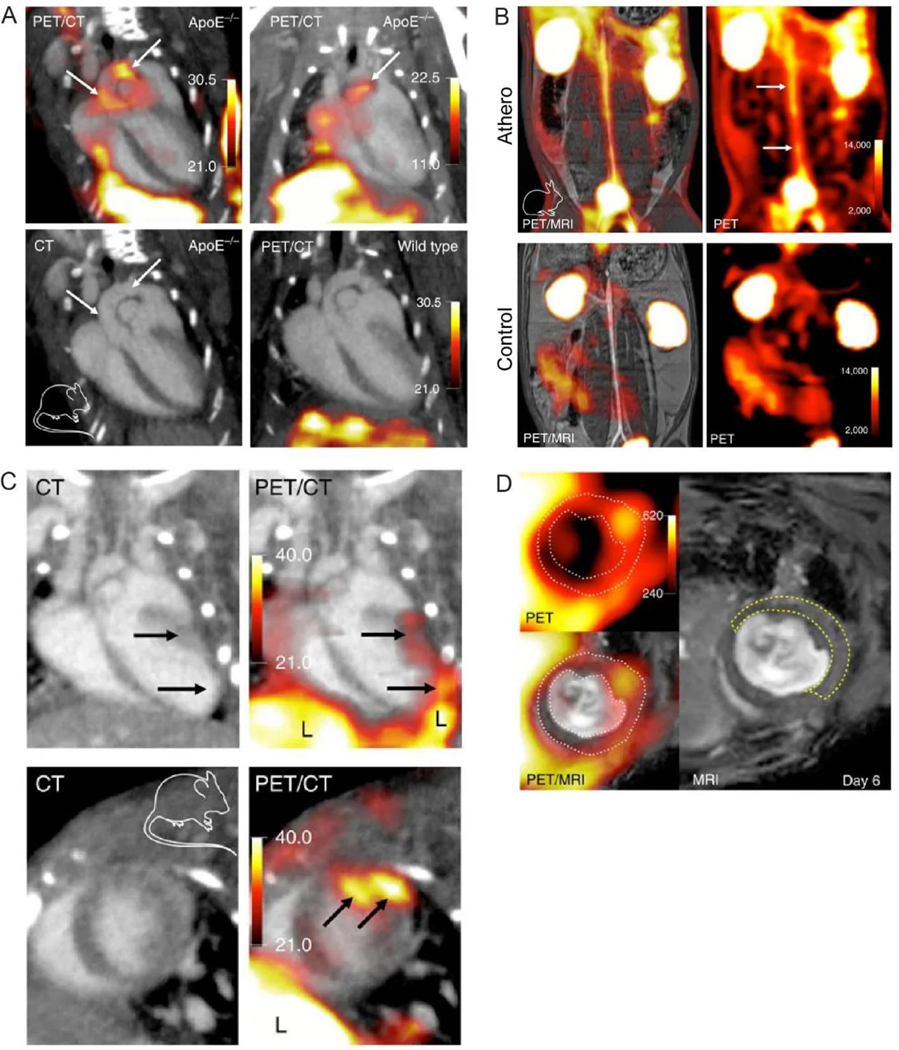
Figure 5. Applications of 18F-Macroflor.

PET imaging of aortic plaques in atherosclerotic mice (A) and rabbits (B). PET imaging of mice with acute myocardial infarction at day 6 post MI (C and D). White dotted line on PET/MRI outlines myocardium. Yellow dashed line on MRI outlines the infarct identified by gadolinium enhancement and wall motion abnormality in cine loops. Adapted with permission from reference 81
