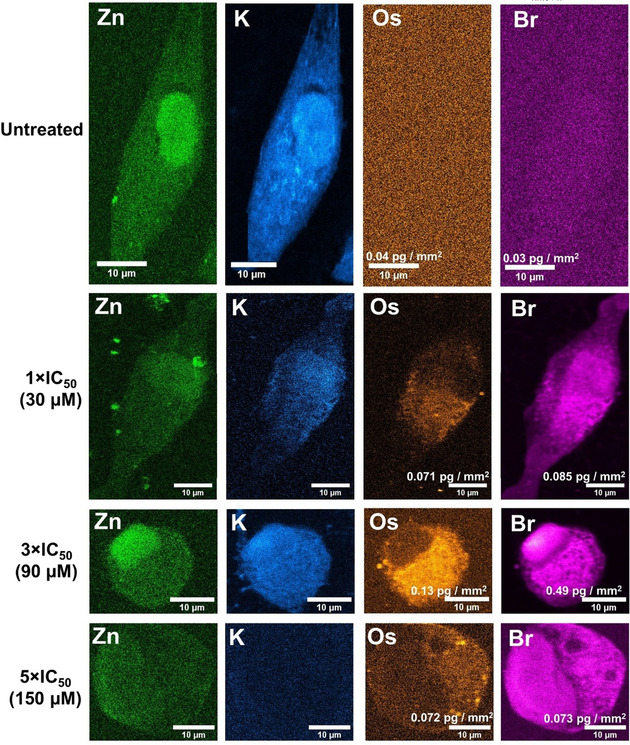
Figure 3.

XRF elemental maps acquired from cryo‐fixed and freeze‐dried A549 (human lung) cancer cells treated with 1–5×IC50 (30–150 μM) of S,S ‐2 for 24 h showing the distribution of: Zn (green); (ii) K (blue) Os (orange) and Br (pink). Maps were collected using 100 nm step size and 0.1 s dwell time. Data were processed in PyMca toolkit developed by the ESRF, [15] and images generated in ImageJ. [16]
