
Figure 2.
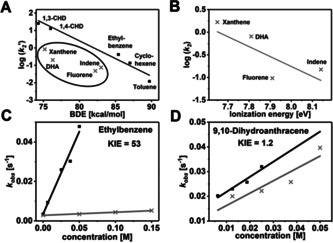
A) Plot of the logarithm of the second order rate constants k 2′ (normalized to the number of equivalent H atoms) of the reactions of 2 with different substrates vs. the BDEC‐H of the respective substrates; the inset shows the substrates that deviate from a linear correlation; B) Plot of the logarithm of the second order rate constants k 2 of the reactions of 2 with different polycyclic substrates vs. the ionization energy of the respective substrates; C) plot of the first‐order rate constants k obs vs. the concentration of ethylbenzene (black) and d 10‐ethylbenzene (grey) for determination of the second‐order rate constants k 2 and the deuterium KIE; D) plot of the first‐order rate constants k obs vs. the concentration of DHA (black) and d 4‐DHA (grey) for determination of the second‐order rate constant k 2 and the deuterium KIE.