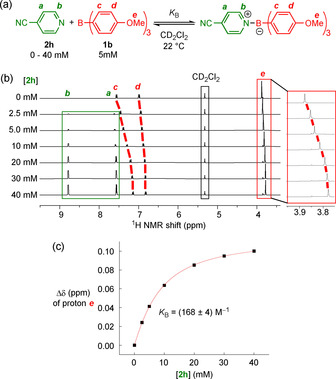
Figure 3.

a) NMR spectroscopic determination of equilibrium constants, K B, shown for the reaction between 2 h and 1 b. b) 1H NMR spectra (400 MHz, CD2Cl2) of borane 1 b in the presence of variable concentrations of 2 h. c) Plot of the chemical shift difference, Δδ, of the methoxy groups of 1 b at different concentrations of 2 h, and the result of numerical fitting used to derive K B (red).
