
Figure 11.
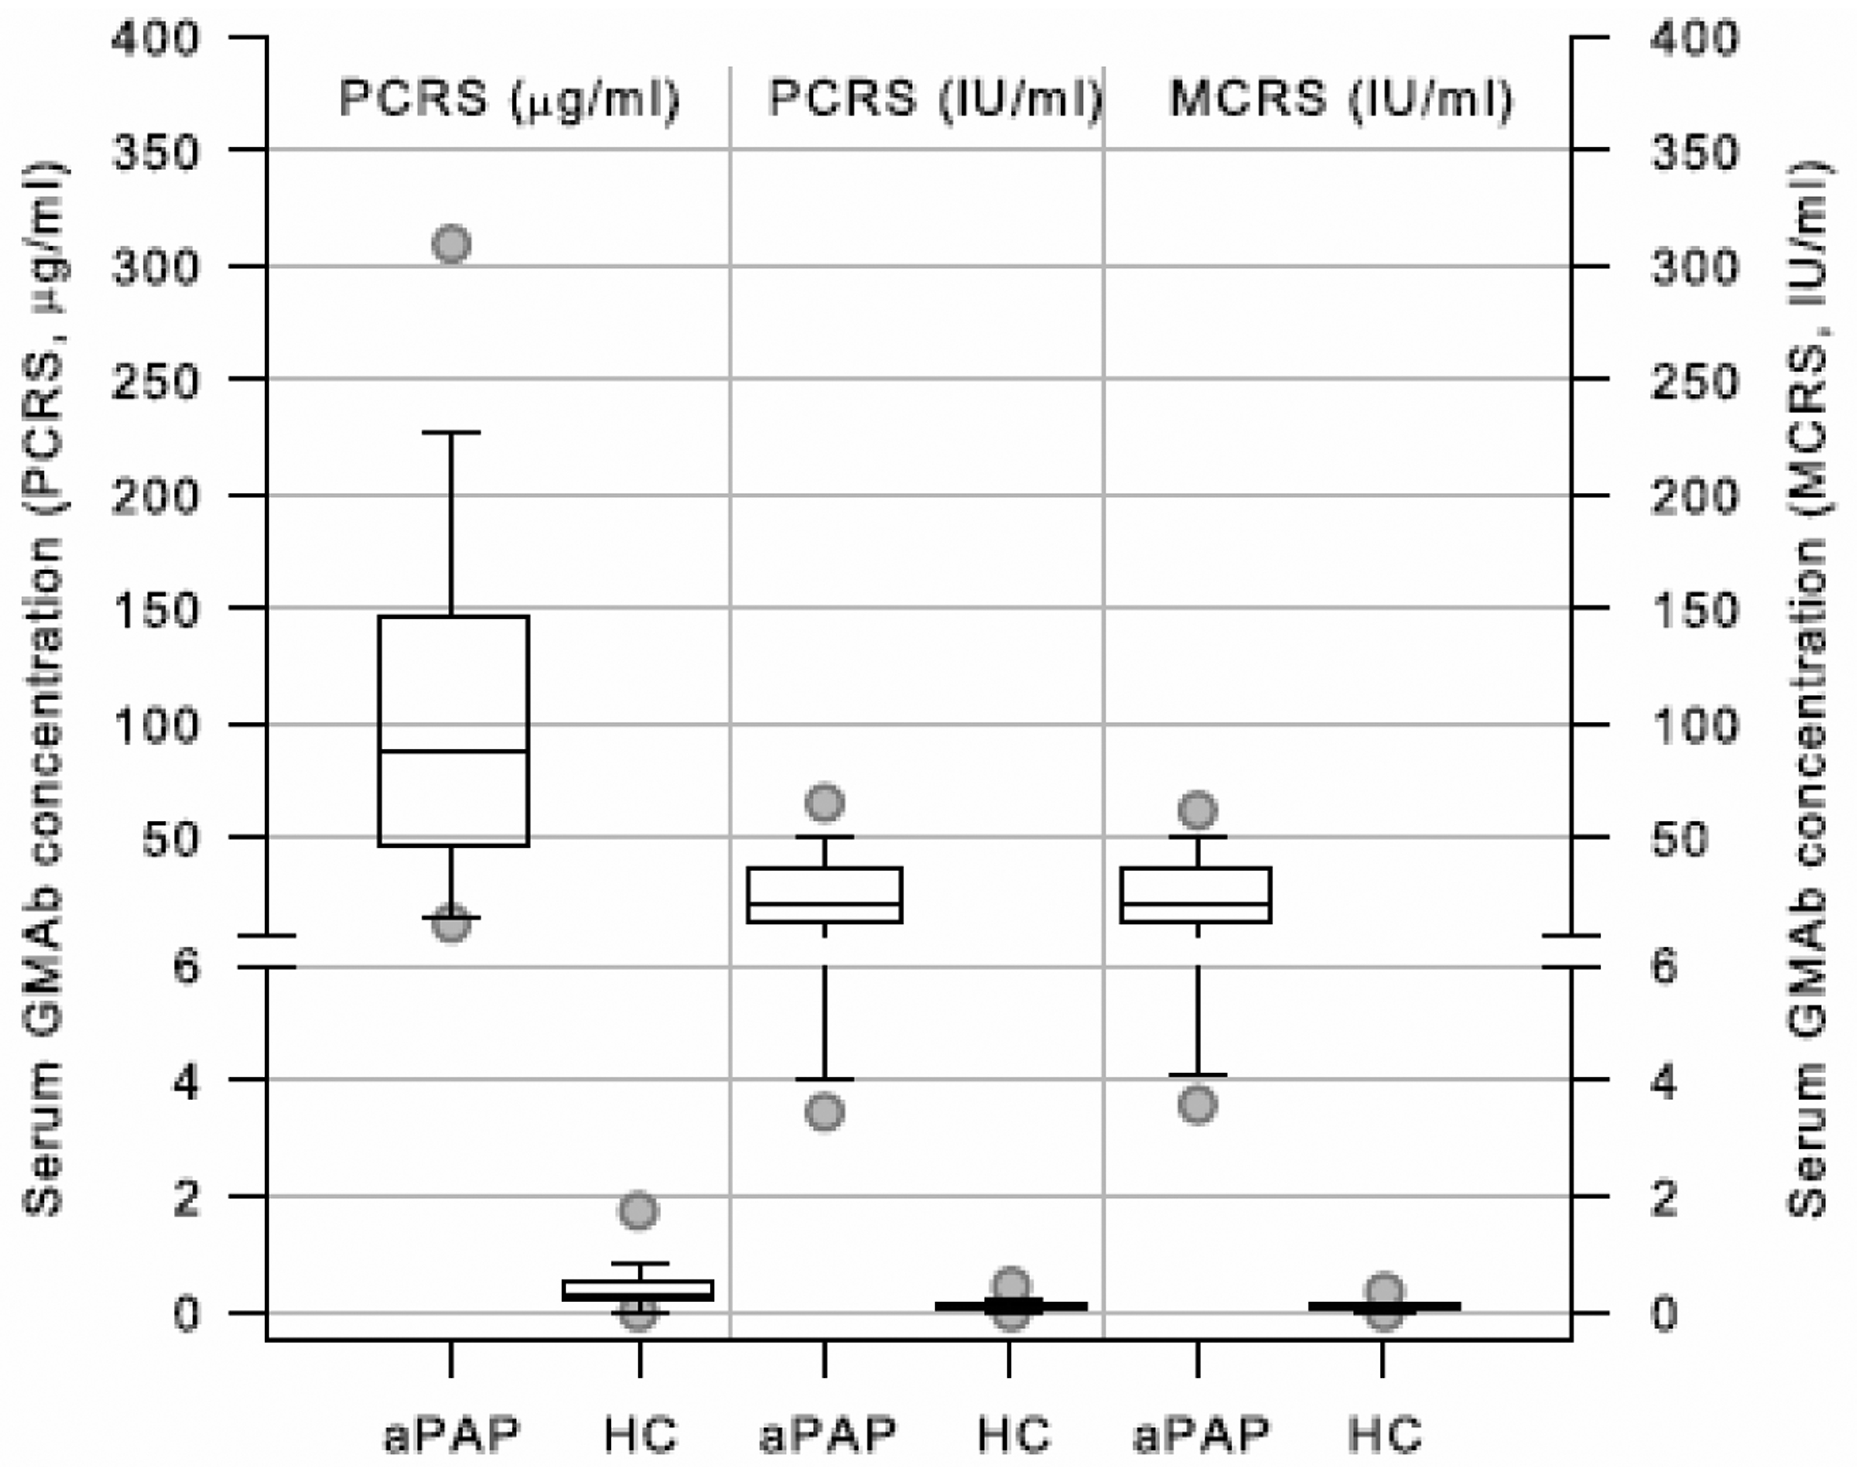
Normal and Abnormal Ranges for GMAb Concentration Expressed in Units of the PCRS, MCRS, and International Units. Serum GMAb concentration in 56 autoimmune PAP patients and 38 healthy people was measured using the GMAb ELISA with the PCRS and converted into international units using the equation parameters determined by the analysis shown in Figure 9C and was also simultaneously measured with the MCRS on the same plate. Box plots show the median (line) and IQR (box top and bottom), and 5th, 95 CI (circles) for patients with autoimmune 56 PAP patients (aPAP), and 38 healthy people (HP).