
Figure 8. Characterization and Performance of Pharmaceutical-Grade, GMAb Monoclonal Reference Standard (MCRS).
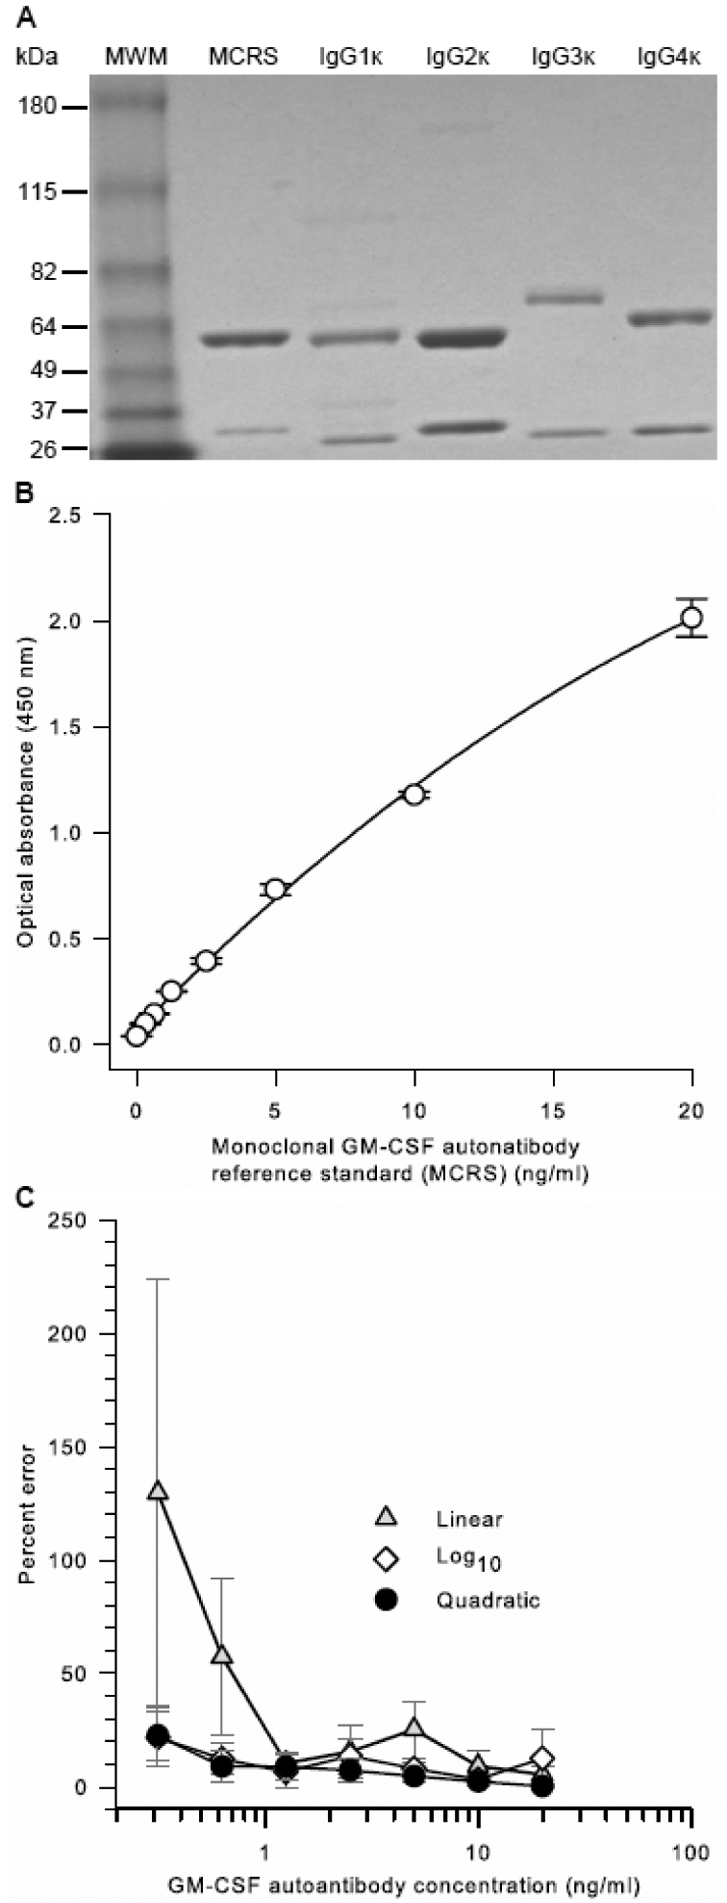
A. Purity of the MCRS. The MCRS was prepared as described in the methods. MCRS, commercially available IgG heavy chain isotype standards (IgGκ 1, 2, 3, or 4), or molecular weight markers (MWM) were subjected to polyacrylamide gel electrophoresis under reducing conditions, Coomassie blue staining, and photography as described in the methods.
B. Optical Absorbance of the MCRS as a Function of Concentration. The MCRS was serially diluted and evaluated as the standard in the GMAb ELISA as described in the methods. Optical absorbance increased smoothly in proportion with MCRS concentration. Regression analysis using a quadratic equation yielded a correlation coefficient (R2) of 0.999.
C. Effect of Regression Method used on Percent Error of the MCRS Curve Fit. Results from 6 independent, simultaneously conducted experiments determining the optical absorbance of serial dilutions of the MCRS were subjected to linear, quadratic, or logarithmic regression analysis and the percent deviation at each concentration was determined. The percent error of the [GMAb]PCRS measurement was calculated as [GMAb]PCRS minus [GMAb]MCRS divided by [GMAb]MCRS multiplied by 100; where [GMAb]PCRS are the unconverted values (None) or values after conversion using the linear, quadratic, or cubic regression equation parameters (indicated) and [GMAb]MCRS is the value actually determined using the MCRS (assumed to be the true value). The mean (±SD) correlation coefficients for regression analysis of 6 separate experiments (not shown) were 0.999 ± 0.0004 (quadratic), 0.990 ± 0.008 (log10), and 0.982 ± 0.0168 (linear).