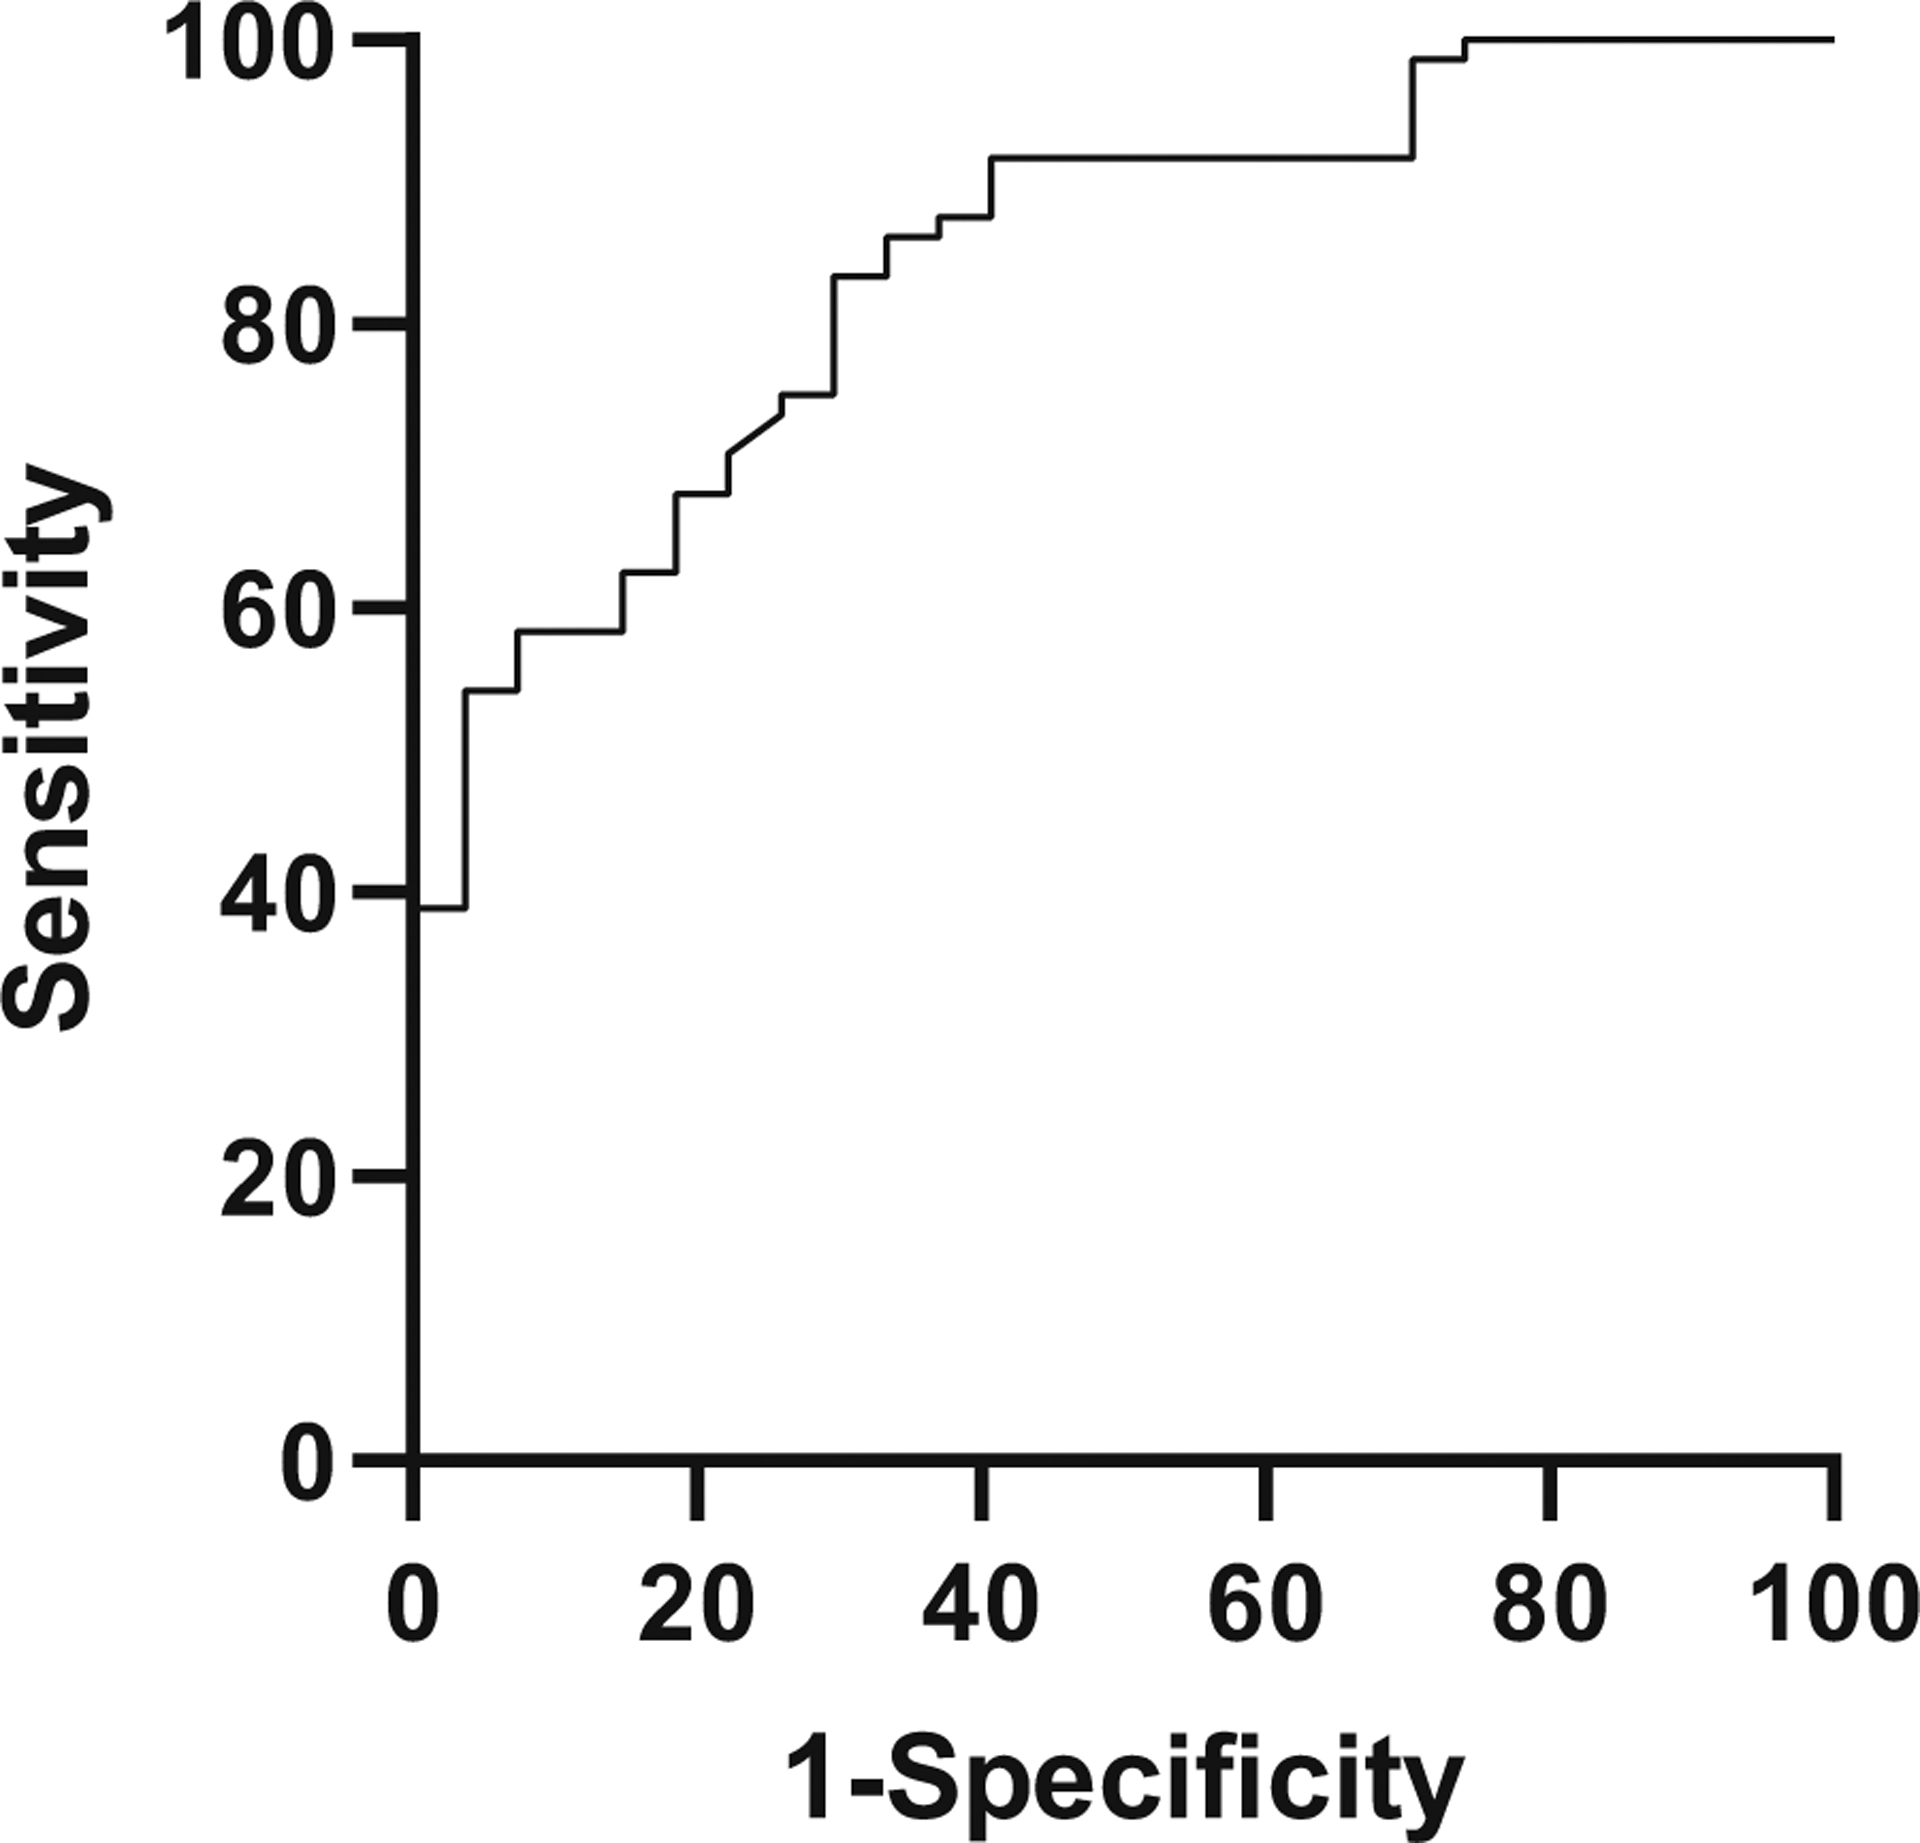
Fig. 4. Receiver–operator curve, to distinguish rule-out NEC from confirmed NEC.

With Stages 2 and 3 denoted as “positive” and rule-out NEC as “negative,” sensitivity is plotted on the Y-axis and 1-specificity or false positive rate on the X-axis. These parameters are optimized at an AMC change of −50% from baseline, which is 51% sensitive and 93% specific in the diagnosis of true NEC, with a positive likelihood ratio of 7.28.
