
Figure 1.
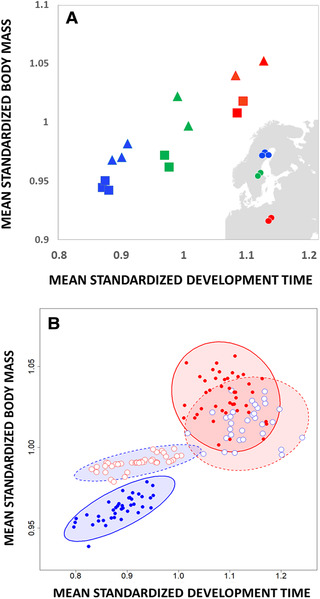
(A) significant latitudinal variation in body mass and development time among seven populations reared at their native photoperiod length. Male values are represented by squares and female values are represented by triangles. Dots on the map show sample location of the populations studied. Standard errors are <0.01 and not shown. (B) geographic variation and developmental plasticity in body mass and development time. Shown are breeding values estimated from the Bayesian mixed model run on mean‐standardized traits (model specification in Supplementary Information 6). Breeding values for southern and northern populations are shown as red and blue points, respectively. Breeding values from populations raised at their native and nonnative photoperiod are filled and open points, respectively, and surrounded by 95% confidence ellipses drawn with full and broken lines, respectively. The northern photoperiod caused a significant shift in the orientation of G in the direction of multivariate developmental plasticity, seen in populations of both northern and southern origin. Northern populations have evolved stronger plasticity in response to the photoperiod cue relative to southern populations.