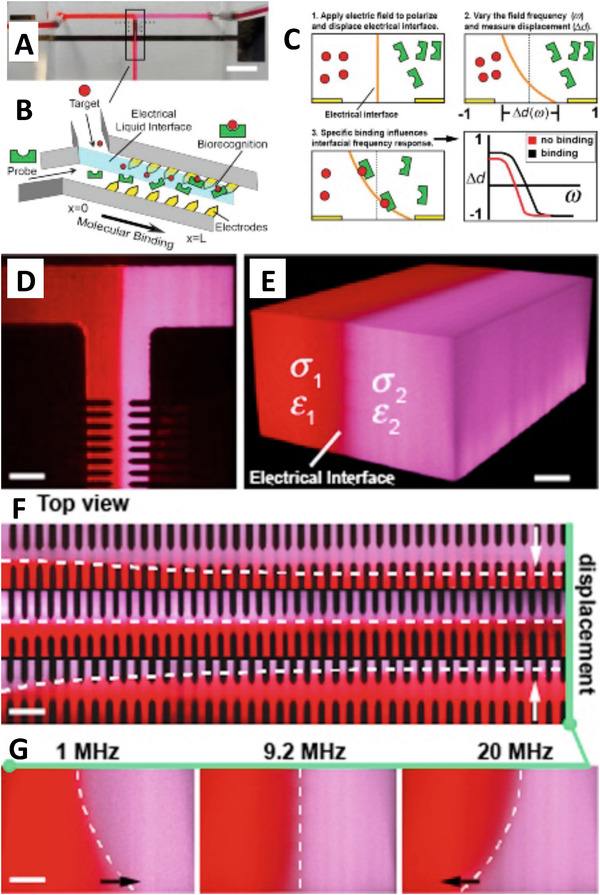
Figure 4.

Use of DEP to detect molecular interactions. (A) A liquid interface is created using a T‐channel microfluidic device. Scale bar 5.0 mm. (B) Integrated electrodes in the channel influenced the electrical liquid interface to create the interfacial electrokinetic transduction (IET) sensor. (C) The applied electric field polarized the interface between the two liquids and displaced it a distance Δd. This distance was a function of the field frequency. If binding occurred between the target and the probe at the fluid interface, then the frequency dependency of the interface displacement would change, which indicated target detection. (D) The two fluorescently labeled fluids are shown in the T junction forming a liquid interface. Scale bar 50 μm. (E) A 3D reconstruction of the fluid interface using confocal imaging. Scale bar 20 μm. (F) As the fluid passed by the electrode array its displacement could be measured as a function of the applied frequency. Scale bar 50 μm. (G) A side view of the fluid profile as a function of the applied frequency using confocal microscopy. Scale bar 20 μm. Reprinted from [46]. Copyright 2015, with permission from Elsevier.
