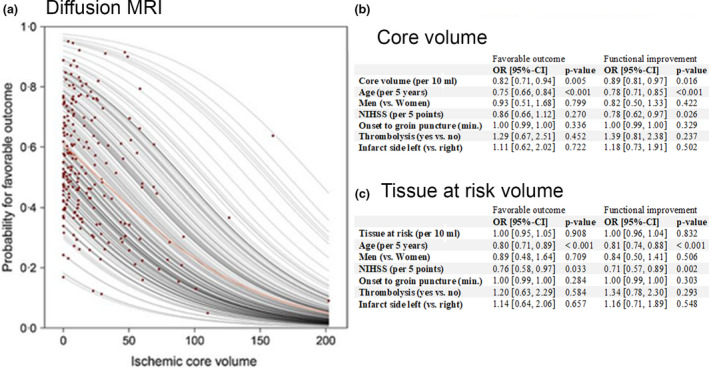
Figure 3.

Association of core and mismatch volumes with functional outcome. (a) Partial dependence plot derived from binary logistic regression analysis illustrating the probability for favorable outcome at 3 months (modified Rankin Scale [mRS] scores 0–2) in relation to ischemic core volume derived from diffusion‐weighted imaging. Each red dot indicates an individual patient. (b and c) show the results of a binary logistic regression for favorable functional outcome (mRS scores 0–2 vs. 3–6) and an ordinal logistic regression (proportional odds model) for functional improvement (mRS scores 0–6) investigating the association between infarct core (b) and tissue at risk (c) on the outcome. CI, confidence interval; NIHSS, National Institutes of Health Stroke Scale; OR, odds ratio. [Colour figure can be viewed at wileyonlinelibrary.com]
