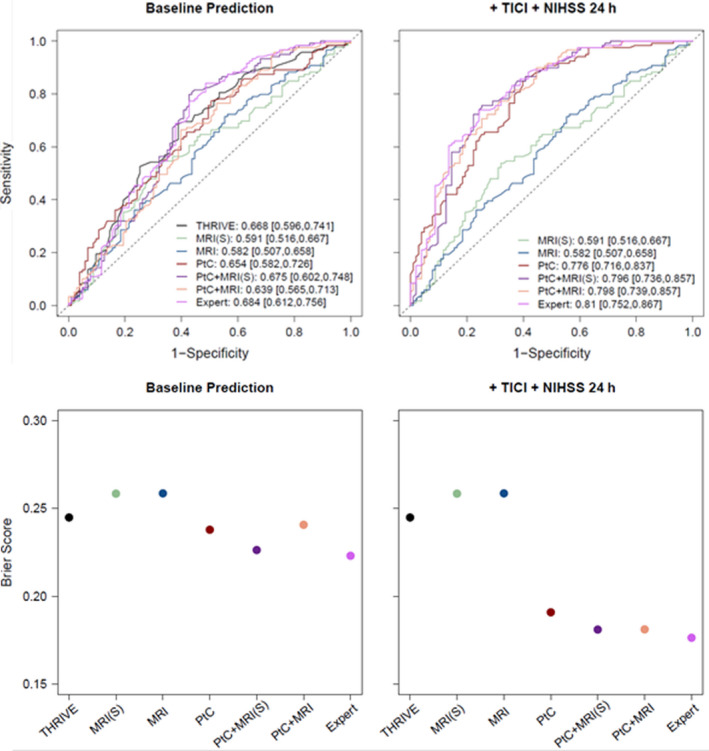
Figure 4.

Receiver‐operating characteristic curves and corresponding area under the curve (AUC) values (upper row) together with Brier scores (lower row) of the random forest classifier for predictor sets with imaging variables from all perfusion maps. Five predictor sets ‐magnetic resonance imaging features from the stroke hemisphere (MRI(S)), from the entire brain (MRI), patient characteristics (PtC), and a combination of both (PtC + MRI(S) and PtC + MRI) ‐ were compared with the Totaled Health Risks in Vascular Events (THRIVE) score and the expert predictor set (Expert). The dotted line in the upper panel indicates the random model. In case of perfect discrimination, the AUC value would reach its maximum of one and the Brier score it's minimum of 0. Models are compared at time point baseline prediction (left column) and after adding Thrombolysis In Cerebral Infarction scale (TICI) and National Institutes of Health Stroke Scale (NIHSS).
